Will Bitcoin Crash Below $100,000? These Indicators Provide the Answer

On-chain metrics, RSI divergences, and whale activity show why the current decline may not be the beginning of a crash, but a new accumulation phase before the rally.
October was a month of contradictions: some metrics point to accumulation and stability, while others point to the fading of the cycle and the possible onset of a correction. BeInCrypto's editorial team compiled data from on-chain analytics, technical charts, and AI models to understand whether the market is on the verge of a new momentum or the calm before the storm .
October's decline stimulates accumulation
Some traders are drawing parallels between the current situation and the end of 2020, when Bitcoin was trading at around $12,000 , well below its previous high. Back then, the cryptocurrency was considered “dead” amid a boom in stocks, SPACs, and meme stocks like GME. However, within a quarter, BTC had risen by more than 170% .
“It seemed like it was all over. Everyone had switched to the stock market and forgotten about crypto. And then, suddenly, the impossible happened. Now, no price movement can fool me,” said one investor.
On-chain data confirms this sentiment. According to Glassnode, active accumulation of Bitcoin by small and medium-sized wallets (1 to 1,000 BTC) has been observed since the beginning of October. This is happening despite the Bitcoin price's collapse from $118,000 to $108,000.
The Glassnode Accumulation Index shows that retail and mid-sized holders are showing renewed confidence while large investors have paused selling.
A similar trend is reflected by the MVRV Z-Score , a metric that compares Bitcoin's market value to its realized value. According to Stockmoney Lizards , the score is currently at 2.15 , which historically corresponds to the accumulation phase rather than the peak of euphoria.
“The pattern is clear: when the value is below 2, the market is in pain, but that's precisely when smart money buys. We're far from overheating, and there's still plenty of opportunity ahead,” analysts note.
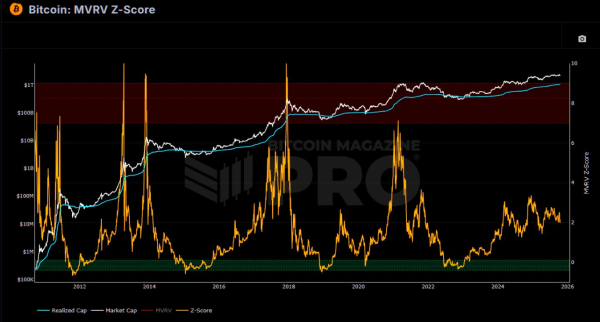 Bitcoin MVRV Z Score. Source: Stockmoney Lizards on X
Analyst Axel Adler considers the $106,000–$107,000 range a key support zone. A loss of this level could lead to a retest of $100,000, where the annual moving average is located. As long as this baseline holds, the market structure, according to Adler, remains bullish.
Long-term shifts and market cycle fatigue
Some analysts warn that the current bullish sentiment may be masking deeper structural shifts. Macroeconomist CredibleCrypto points out that Bitcoin's entire 16-year history has unfolded against the backdrop of a prolonged bull cycle in stock markets—and both may be nearing their end.
“Cryptocurrency could enter its first secular bear market just when traditional stocks face a similar scenario,” the analyst warns. In such a scenario, he says, the market could face “destruction on all fronts.”
This view contrasts sharply with analyst Miles Deutscher, who believes that Bitcoin's role as “digital gold” is gradually separating it from traditional risk assets.
“Bitcoin is gradually moving away from being just part of the risk-on asset category and becoming an alternative to gold and bonds,” Deutscher wrote on X (formerly Twitter).
AI forecasts, cycle theories, and market psychology
Analysts working with artificial intelligence models are also joining the discussion about Bitcoin's future. Quantitative researcher Timothy Peterson notes that his AI model still estimates the probability of October ending above $114,000 at 75% .
“Even in a pessimistic scenario, Bitcoin retains about 50% growth potential from current levels,” he clarified.
At the time of the forecast, two weeks before the end of October, Bitcoin was trading at $105,232 , having lost more than 4% in a day.
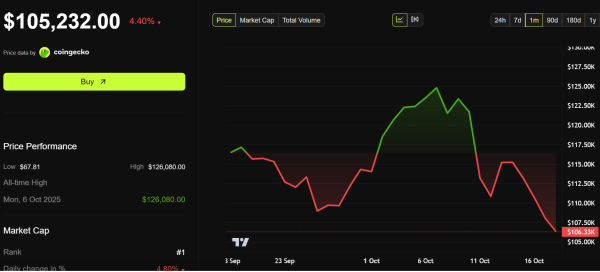 Bitcoin (BTC) Price Dynamics. Source: BeInCrypto
Analysts studying market cycles partially share this optimism. Trader Cyclop calculated that Bitcoin's previous bullish phases lasted on average about 1,060 days . This places the current cycle within 90 days of a possible peak , which could occur in November–December 2025 .
“We're entering the riskiest, but also most rewarding, phase of the bull market,” he warns. “Winners average out winners, and losers average out losers.”
Meanwhile, analyst JDK Analysis cautions against jumping to conclusions, pointing out that each subsequent bullish cycle in Bitcoin's history has been longer than the last. He believes the current growth phase is not yet over.
Bitcoin on the brink – crucial defense of the 200-day EMA
Technically, Bitcoin is holding at the 200-day exponential moving average (EMA), the classic boundary between a bullish and bearish market.
Investor Lark Davis notes that this level is currently determining the fate of the trend:
“Bitcoin is clinging to the 200-day EMA. This is the dividing line between bulls and bears. If buyers fail to hold their position, we'll see a test of support at $100,000 . But if a rebound occurs, it will confirm the accumulation scenario and maintain the market's upward structure.”
Amid conflicting signals—confident on-chain accumulation and growing pressure on futures—October is turning into a moment of truth. The market is balancing between fear and hope, and the dynamics in the coming weeks could determine the direction for the rest of the year.
Ultimately, it is the behavior of small investors who continue to buy into the declines that may decide whether the current consolidation will be a respite before the fall or a lull before a new parabolic rise.
So, Bitcoin is going through a period of uncertainty, but the market structure remains bullish as long as the price remains above the 200-day EMA. Strong accumulation, growing holders, and the restraint of “old whales” indicate that the market is not yet overheated.
However, the coming weeks will decide everything. If buyers can defend the $100,000 level, the October pause will be just another respite before a new round of growth. If not, the market could enter a cooling phase, ending the current cycle.
Source: cryptonews.net