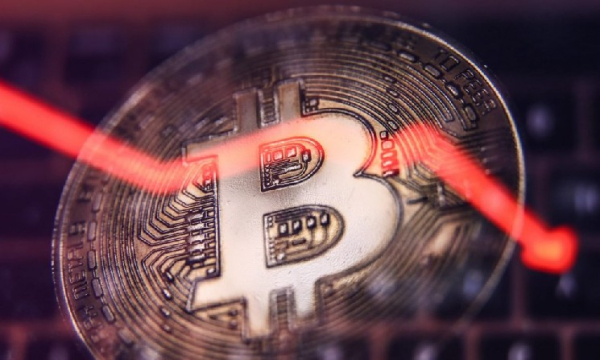
Will Bitcoin (BTC) Buyers Reverse the Bearish Trend?
Bitcoin (BTC) price is struggling due to selling pressure. BTC is down 3% in a week. It has gained just 0.3% in the last 24 hours, and there is little change on the hourly chart.
This narrow range dynamic reflects a battle between buyers and sellers. However, on-chain data shows an encouraging sign that could determine the next move.
Exchange Flows Show 10 Days of Pressure
One way to track pressure is through net flows on exchanges. Positive flows mean more coins are flowing into exchanges, which often indicates selling. Outflows mean coins are leaving exchanges, which usually signals buying.
Bitcoin flows into exchanges have remained stable for 10 sessions in a row. On August 24, they peaked at 6,775 BTC, one of the largest daily totals in recent months. Even after that, flows remained high, with the value still exceeding 4,239 BTC on August 26.
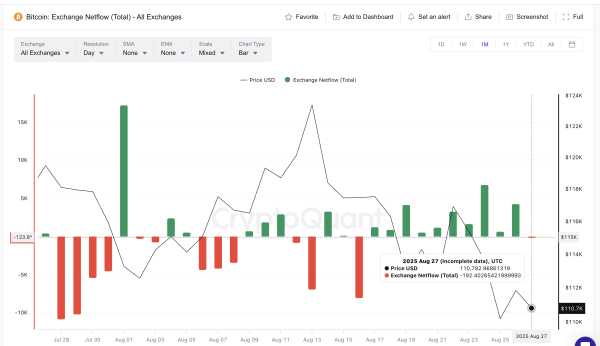 Bitcoin Inflow Series: Cryptoquant
For the first time in 10 days, the situation has changed. Net flows have turned negative, at -192 BTC. This shows that sellers may be starting to lose control, albeit slightly.
At the time of publication, buyers are trying to take control, but the outcome is not yet clear. If inflows increase again, the series could extend to day 11, and the selling scenario will remain relevant.
NUPL Short-Term Holders Offer Glimmer of Hope
An encouraging signal is coming from short-term holders – investors who have held Bitcoin for less than 155 days. Their activity is tracked using the NUPL (Net Unrealized Profit/Loss) metric, which shows how much profit or loss they have compared to when they bought it.
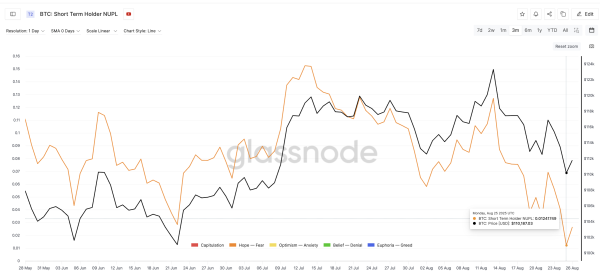 NUPL Metrics for Short-Term Bitcoin Holders: Glassnode
The NUPL short-term holders' ratio has fallen nearly 90% in just 40 days. It fell from 0.152 in mid-July to 0.012 on August 25, the lowest level in three months. It has since rebounded slightly to 0.026, but is still close to its low.
Each time the short-term holders' NUPL has fallen to such low levels, the price of Bitcoin has recovered. On June 5th, when the value reached 0.04, the price of Bitcoin rose from $101,626 to over $110,000. On June 22nd, when the value reached 0.02, prices began to rise again shortly thereafter. On August 2nd, when the value reached 0.05, Bitcoin jumped from $112,571 to $123,345.
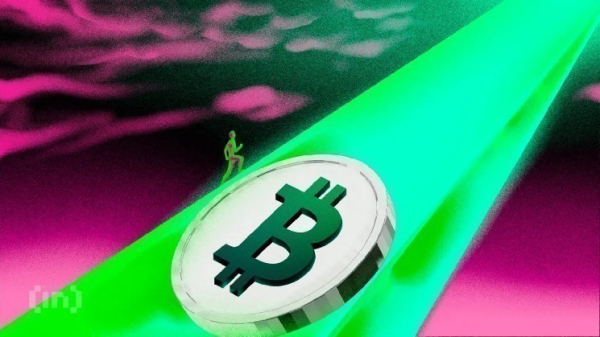
Now the situation is repeating itself. If the pattern continues, this could be the beginning of a new rise in the price of Bitcoin.
Bitcoin Price Levels to Watch
The price of Bitcoin at the time of writing fluctuates between $108,600 and $112,300. This narrow range shows how balanced the battle between buyers and sellers is.
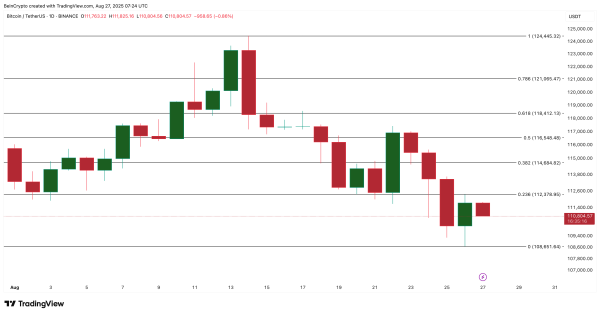 Bitcoin Price Analysis: TradingView
If sellers increase the pressure and inflows increase for the 11th day in a row, Bitcoin could break through the $108,600 level, which would lead to deeper losses.
However, if buyers hold the current small outflow and NUPL patterns repeat, the first target will be a strong close above $112,300. After that, Bitcoin could rise to $116,500 and then $118,400, which will be the levels that need to be broken for more significant gains.
Bitcoin is currently stuck between selling pressure and an encouraging signal from short-term holders. If the inflows stop, the bulls will have a chance to rally. Otherwise, another decline is possible.
Source: cryptonews.net