Bitcoin attempted to reach the $112,000 mark after weak US inflation data.

Main:
-
Bitcoin's price began to fluctuate after the release of the CPI index, which turned out to be lower than expected.
-
Optimism in the risky asset market has grown, with participants expecting the Fed to continue cutting interest rates until 2026.
-
Bitcoin faced resistance at $112,000, with key support levels starting to form.
Bitcoin (BTC) experienced renewed volatility on October 24 following the release of lower-than-expected US inflation data. Despite the stock market's rise to new highs, the asset's price failed to sustain its momentum.
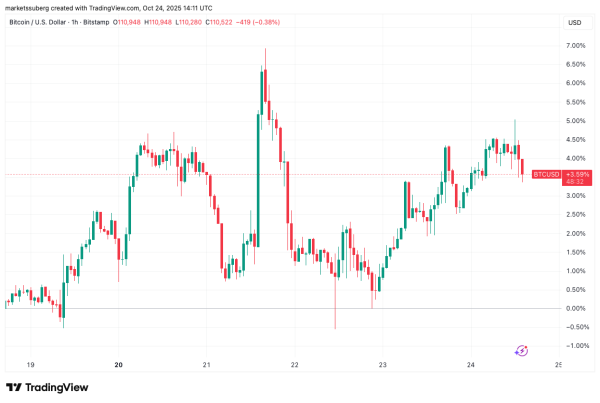 BTC/USD Hourly Chart. TradingView.
Slowing inflation pushes US stocks to new highs
According to TradingView, the price of the first cryptocurrency rose to $112,000, but then reversed downwards after the opening of trading in the US.
The CPI inflation indicator for September was below expectations across the board, a factor that traditionally supports risk assets, including digital assets.
The core and main CPI indexes were 0.1% below forecasts, or about 3%, according to the US Bureau of Labor Statistics (BLS).
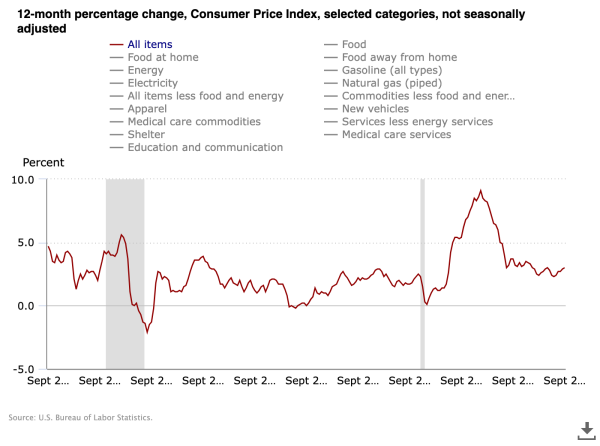 Consumer Price Index (CPI) Changes Over the Year. Source: BLS.
The Kobeissi Letter noted that these data pave the way for another Fed rate cut next week.
The publication also clarified that the report was a “rare exception” and was released even during the ongoing US government shutdown.
On the topic: the US Senate announced a new round of crypto regulation amid the third week of the shutdown.
On the back of the news, the S&P 500 index reached a new all-time high.
According to the Chicago Mercantile Exchange (CME Group), the market is almost unanimously expecting them to decline by 0.25% on October 29.
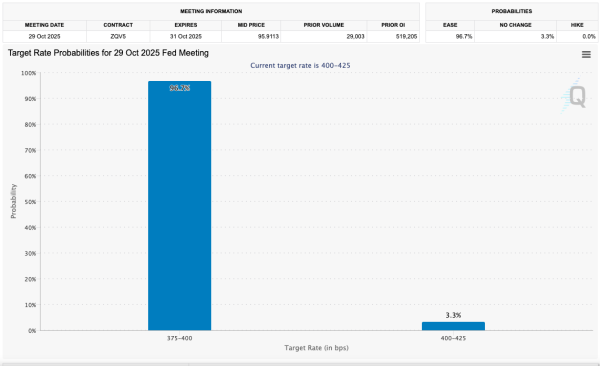 Fed rate change probabilities. Source: CME Group.
Financial conditions remain generally easy and are receiving additional support from expectations of two remaining rate cuts before the end of the year, according to analysts at Mosaic Asset Company.
This, they estimate, should support the economy and corporate reporting, providing a foundation for continued growth in 2026.
On the topic: hopes for the alt-season are growing, but there are no signs yet – opinion
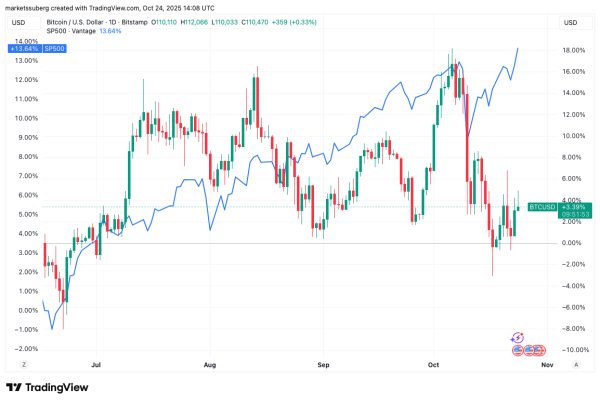 BTC/USD daily chart compared to the S&P 500. Source: TradingView.
Bitcoin price failed to maintain momentum
Despite positive inflation data, digital gold faced selling pressure after the opening of trading in the US.
Traders remained cautious. A user named Exitpump warned of weak support below the current price.
Analyst Diego White described the exchange order book situation as “dire.” According to CoinGlass, the price has approached a new buy order level near $110,000.
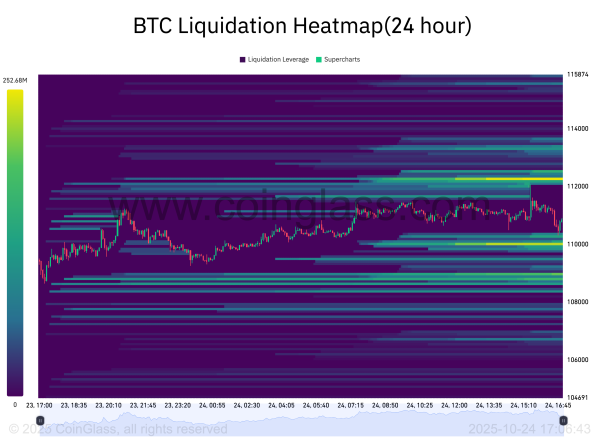 Bitcoin liquidation heat map. Source: CoinGlass.
Caleb Franzen, the author of the research project Cubic Analytics, noted that the first cryptocurrency is currently rebounding from the 200-day exponential moving average (EMA), but to recover, it must consolidate above the 21 and 55 EMA levels, which acted as resistance at the beginning of the week.
“The stock is currently holding at the 200 EMA, but needs to break and close above the 21/55 EMA to confirm the upside,” Franzen wrote.
On the topic: Worst October in history? Bitcoin remains in the red since the beginning of the month.
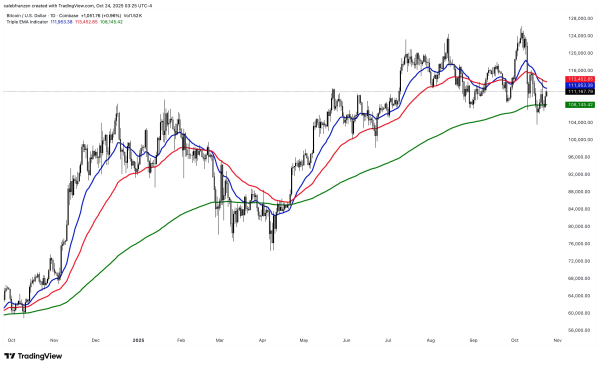 BTC/USD daily chart with 21-, 55-, and 200-period EMAs. Source: Caleb Franzen/X.
This article does not contain investment advice or recommendations. Every investment and trading decision involves risk, and readers should conduct their own research before making decisions.
Source: cryptonews.net