This factor could push the price of Bitcoin (BTC) above $130,000.

Bitcoin started October with a strong rally. It's up nearly 9% this week and remains above $124,000, despite a slight pullback from its recent all-time high.
$130,000 is the next major target, as indicated by both technical patterns and on-chain data.
Bitcoin net inflows to exchanges hit a multi-year low.
Bitcoin exchange flow shows the difference between coins entering and leaving centralized exchanges. A negative value indicates that more BTC is being withdrawn than deposited, which typically indicates that holders are holding rather than selling.
As of October 4, the 14-day simple moving average (SMA) of Bitcoin net flows is -7,210 BTC. This is the lowest level in nearly three years. The last time net flows fell this deeply was in November 2022, shortly before BTC soared from $16,000 to over $72,000 in the following months.
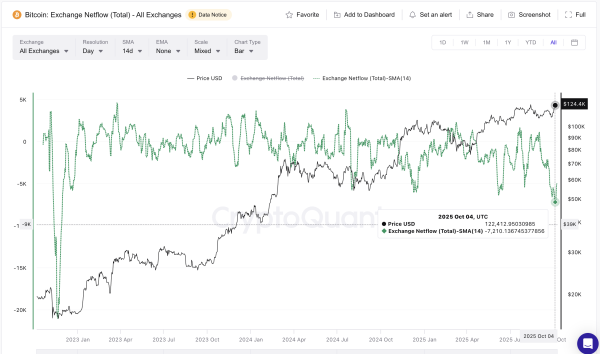 Net Bitcoin Flow on Exchanges: CryptoQuant
The HODL Waves metric tracks how long coins remain stagnant. Over the past month, both short-term and long-term holders have increased their holdings. The 1-3 month group grew from 8.75% to 9.59% of the total supply, while 2-3 year holders increased from 7.00% to 7.13%.
While a 0.13% increase may seem insignificant, it actually represents tens of thousands of BTC—a significant change relative to Bitcoin's overall supply and a clear signal of renewed confidence among long-term holders.
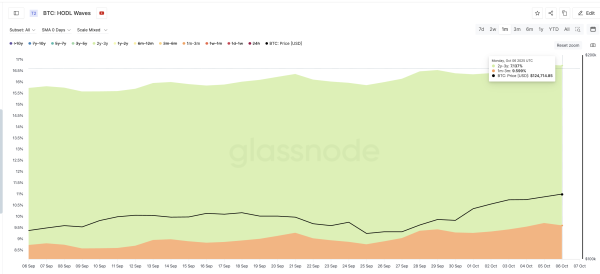 Key Bitcoin Holders Increase Their Holdings: Glassnode
Now, both groups of holders – long-term and short-term – are showing confidence, thereby creating a stronger foundation for sustainable growth.
BTC's breakout target is $130,100.
On the daily chart, Bitcoin's price recently confirmed a breakout of the inverse head and shoulders pattern, closing strongly above $122,100. This pattern points to a potential rise above $130,000 if momentum continues. A breakout of this level would pave the way for new cycle highs this quarter.
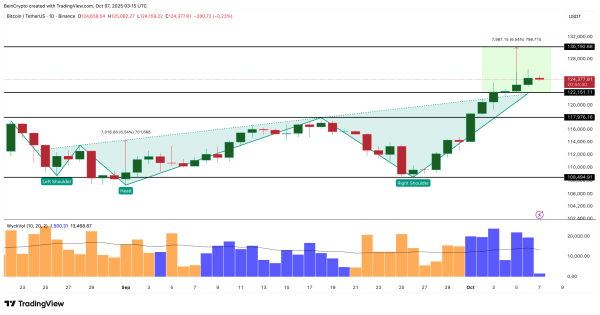 Bitcoin Price Analysis: TradingView
However, a drop below $117,900 and $108,400 would temporarily cancel this bullish scenario, although on-chain metrics still point to an uptrend.
Source: cryptonews.net