The Bitcoin market is in a bearish trend and the decline will continue.

Today, Bitcoin's daily chart paints a bearish picture, as the price of BTC has fallen 3.1% from its daily high of $110,665 to $106,500.
With increasing volume on red candlesticks, sellers continue to push the price of the leading cryptocurrency downward. The red engulfing candlestick on November 2-3 foretells even greater problems, reinforcing the current bearish sentiment.
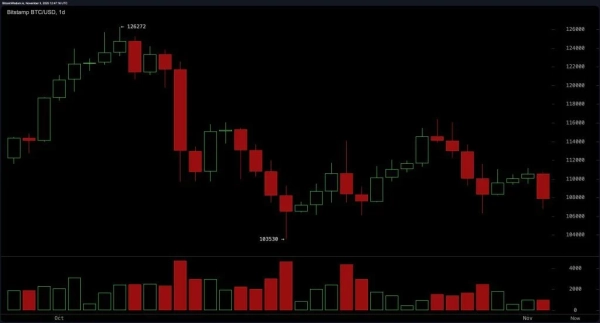
BTC/USD daily chart on Bitstamp, November 3, 2025
Looking at the 4-hour chart, we see that after breaking out of the sideways consolidation, Bitcoin rebounded with difficulty, but trading volume was low.
A short-term rally to the $110,000-$110,800 range could be just a prelude to a continuation of the downtrend unless Bitcoin closes above $108,000 amid bullish momentum.
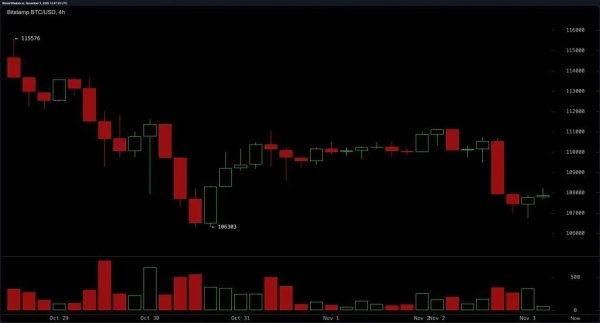
BTC/USD 4-hour chart on Bitstamp, November 3, 2025
The hourly chart clearly shows a downward trend, making short positions more attractive.
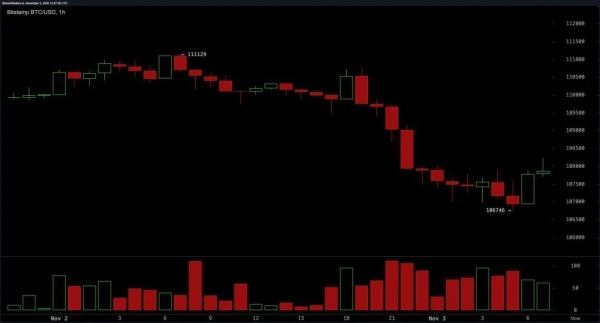
Bitstamp BTC/USD Hourly Chart, November 3, 2025
The Relative Strength Index (RSI) is at 41, signaling neutrality, while the Stochastic Oscillator is at 33. The Commodity Channel Index is hovering at -67, and the Average Directional Index (ADX) is showing a weak trend at 17. Even the “Amazing Oscillator” is undecided at -4257, although the Momentum and Moving Average Convergence Divergence (MACD) are pointing to bearish pressure, reading -3214 and -1171, respectively.
Every key exponential moving average (EMA) and simple moving average (SMA) from 10 to 200 days is above the current price action, confirming the prevailing downtrend. With the 200-day EMA at $108,409 and the simple moving average at $109,876, Bitcoin is unable to maintain even long-term support lines.
Until buyers become active with volumes, the trend clearly points to a further decline, which will be accompanied by short rebounds and strong resistance.
Source: cryptonews.net