Analyst notices Q2 pattern repeat on Bitcoin chart

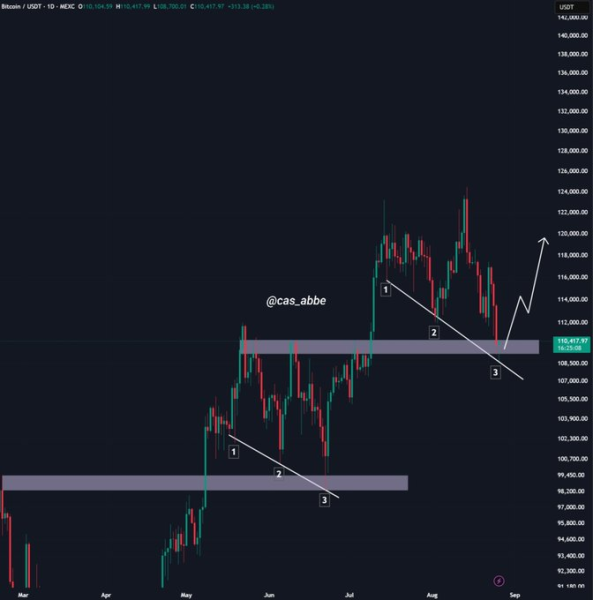
The current chart of the first cryptocurrency shows similarities with the pattern of the second quarter, when the asset reached a historical maximum of $112,000 and fell to $98,000. This was noted by CryptoQuant contributor Cas Abbe.
 Source: X.
“[There were] similar lower lows and capitulation that made everyone think ‘it’s over’. In fact, Bitcoin even went below the trendline – this could happen again. I know many of you are scared, but all you need to do is hold your positions,” the expert wrote.
At the same time, a trader under the nickname BitBull announced the approach of the local bottom of the crypto market.
$BTC is now getting closer to the bottom.
There is still a chance of $106K-$108K level retest, but for now I'm expecting a bounceback.
Coinbase Bitcoin Premium turned positive during bottom and long liquidations were huge.
This shows that max. pain is here and a short rally is… pic.twitter.com/HsTTyiHs6i
— BitBull (@AkaBull_) August 26, 2025
He predicts that digital gold could still fall to $106,000–$108,000.
“The Coinbase premium turned positive during the bottom and the long liquidations were huge. This suggests that the maximum loss is behind us and a short-term rally is expected,” BitBull added.
A user going by the nickname Mister Crypto pointed out the accumulation of a significant amount of liquidity above the $115,000 levels, implying an imminent short squeeze.
$BTC liquidity is piling up on top.
SHORT SQUEEZE INCOMING! pic.twitter.com/qYjzkozfxv
— Mister Crypto (@misterrcrypto) August 26, 2025
At the time of writing, Bitcoin is trading around $110,000, down 3% in seven days.
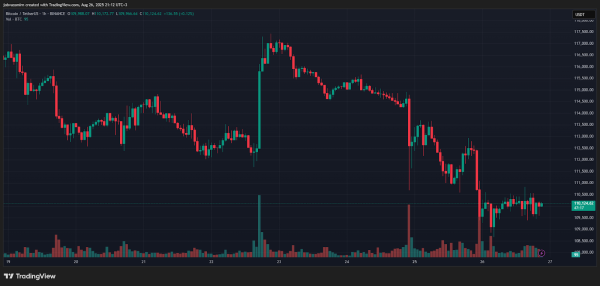 15-minute chart of BTC/USDT on Binance. Source: TradingView.
Let us recall that from August 16 to 22, investment products based on digital assets lost $1.43 billion.
Analyst: Bitcoin Market Gets Rid of 'Weak Hands'
Source: cryptonews.net