Solana Price Analysis: SOL’s Evolving Throwback Pattern Makes It Enticing for Breakout Traders
The pattern has its roots in the behavioral aspects of trading and often sets the stage for bigger bull runs.

What to know:
- SOL's price chart is showing a "bullish throwback" pattern.
- The pattern is seen as a low-risk opportunity for breakout traders, according to technical analysis theory.
In financial markets, the best entry opportunity is often fleeting and easily missed. Now, Solana's SOL is flashing a timely second chance for those looking to trade bullish breakouts.
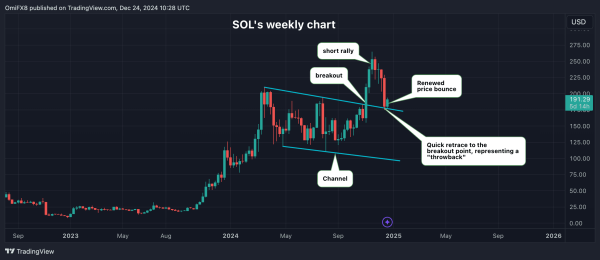
The SOL price has surged over 7% this week to $193, rebounding off a former resistance-turned-support identified by the trendline connecting highs from March and July. This line, and the one joining April and August lows, define a large descending channel comprising prolonged range play from March to October.
The prices broke out of the channel in early November, confirming a bullish bias. SOL quickly climbed to over $260 before retracing to the breakout point last week.
The roundtrip is called a bullish "throwback pattern" by technical analysts.
"Throwbacks occur when prices break out upward and then 'throw back' to their break out level. The retracement is an excellent level at which to participate in the upward trend," Charles D. Kirkpatrick II and Julie R. Dahlquist said in the third edition of "Technical Analysis: The Complete Resource for Financial Market Technicians."
"They tend to be very short in time and distance but often provide a second, lesser-risk opportunity for a breakout trader to enter a position," the authors write.
Breakout traders seek securities that have struggled to surpass a specific level. When the price finally breaks through, these traders enter the market, anticipating substantial movement in the direction of the breakout.
Trading breakouts demands constant monitoring of the markets and careful assessment of price and volume trends. Traders who miss the initial breakout often look to enter on a successful throwback, like SOL's. These entries are generally perceived as low risk since the potential exit point or stop loss can be placed just below the breakout point.

The throwback seen above can be explained by behavioral aspects of trading, particularly prospect theory, which says that people are generally risk-averse when it comes to securing gains. In other words, when presented with potential profits, traders often book those gains rather than letting the winning trade run.
This tendency explains why the first post-breakout rally does not persist for long and prices usually fall back to the breakout point. It's because traders who jumped in with the breakout are quick to take profit on a subsequent move higher.
That's when it gets interesting. The traders who missed the first breakout may see the throwback as a second opportunity to get in. They go long at the breakout point, ensuring the support stays intact. This explains SOL's bounce from the key level.
If SOL continues to rise, those who took profits soon after the initial breakout might regret doing so and take fresh longs, further adding to the bullish momentum. That's how trends develop.
A similar throwback pattern played out perfectly in bitcoin (BTC) in the second half of 2023, setting the stage for a massive bull run.
Note that the bullish throwback pattern will be invalidated if the SOL's price bounce fizzles, allowing for a retrace back into the channel.


