Will Bitcoin Fall Below $100,000? These Three Charts Reveal the Answer

Bitcoin has once again approached a dangerous point. We're looking at what analysts are seeing on the charts—signs of an impending collapse or the beginning of a new rally.
Amid high volatility and mass liquidations, the main question for the market is whether the price will hold above the symbolic $100,000 mark or whether a deeper correction is imminent. To answer this question, it's worth delving into blockchain data and examining charts, which reveal key signals about investor behavior and price dynamics.
Bitcoin is falling, but holders aren't panicking.
A sharp decline in Bitcoin's price has alarmed traders: BTC fell from over $120,800 to $102,000, before quickly rebounding 9% to $111,000. Despite the scale of liquidations, Bitcoin showed relative resilience, falling only 7%, indicating the strength of the current trend. The main question now is whether BTC can hold above $100,000 or will soon break through this key support level.
The behavior of long-term holders is the first sign of market stability. Even during the decline, the number of addresses with a non-zero balance increased from 56.92 million to 56.98 million in just 24 hours. This means that investors were in no rush to sell, but rather used the decline to buy.
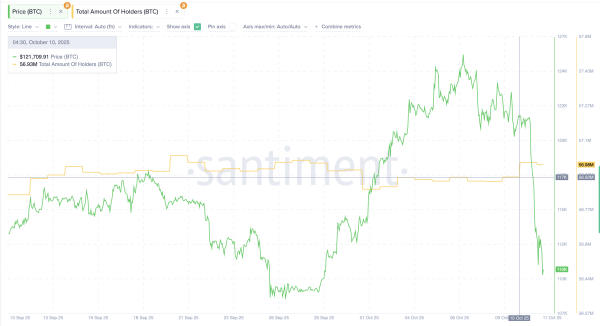 Bitcoin Holders Rise: Santiment
On-chain analytics data confirms this trend. The Spent Coin Age Bands (SCAB) metric shows which coins are moving on the network—those recently purchased or those held for months or years. On October 10th, when the sell-off began, the total volume of coins moved was approximately 17,100 BTC. Coins aged 180 to 365 days (red zone) accounted for approximately 9,995 BTC, while coins aged 1 to 2 years (blue zone) accounted for approximately 2,452 BTC.
As selling pressure intensified, the total SCAB rose to 23,086 BTC—a sign that network activity had surged due to short-term investors. At the same time, the share of “old” coins declined: the 180-365-day range fell to 9,646 BTC, and the 365-day-2-year range to 535 BTC. This suggests that the selloff was primarily driven by new and mid-term market participants, while long-term holders remained calm.
Experienced investors typically hold their positions unless they expect a significant drop—for example, below $100,000. An increase in the number of holders, while veterans remain passive, indicates a redistribution of coins in favor of those willing to hold the asset even in conditions of increased volatility. This shift in ownership structure often becomes a prerequisite for market recovery.
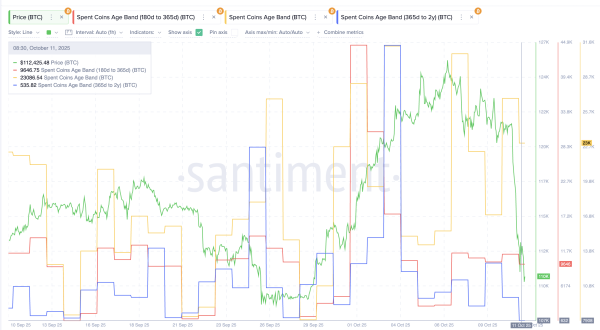 Age Group Metrics for Bitcoin Spent: Santiment
Price momentum has shifted from bearish to bullish
The technical picture shows that the recent decline was not simply the result of market panic, but part of a natural cycle. The collapse coincided with the formation of a bearish divergence in the RSI (relative strength index), which measures the balance of buying and selling on a scale from 0 to 100.
Divergence occurs when the price and RSI move in opposite directions—for example, the price reaches a new high, but the indicator shows a lower peak. This indicates that buying momentum is weakening and often heralds a correction. This is precisely what was observed from mid-July to early October: Bitcoin reached new all-time highs, but the RSI failed to confirm them. This resulted in a decline of almost 19%—similar to the 14% correction that occurred earlier on the same technical signal.
The market is currently showing the opposite pattern. From September 25 to October 11, a bullish divergence appeared on the chart: the price formed a lower low, while the RSI formed a higher low. This indicates a weakening of selling pressure and a possible restoration of upward momentum.
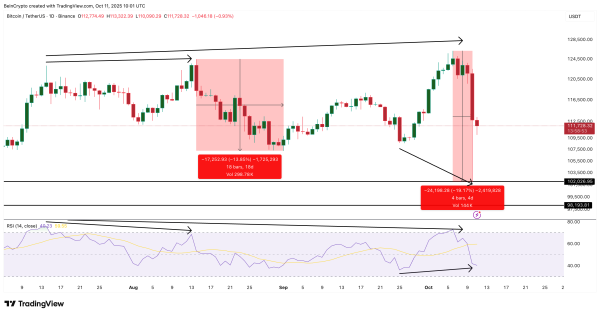 Bitcoin Price Divergence: TradingView
At the time of publication, Bitcoin is trading near $111,600, which corresponds to the 0.5 Fibonacci level ($111,400). If the daily candle closes above this level, the next targets could be $113,600, $116,800, and $120,800.
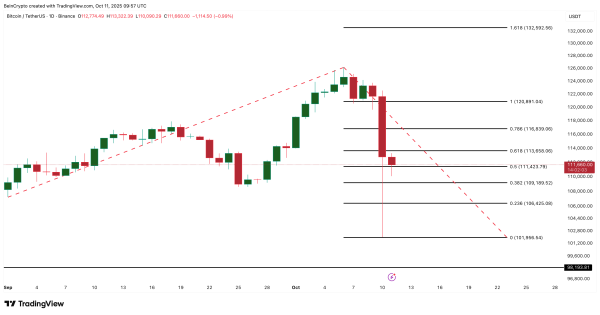 Bitcoin Price Analysis: TradingView
The critical support zone is at $109,100. If the price declines, the nearest defensive levels are at $106,400 and $101,900. Therefore, a drop below $100,000 currently appears unlikely. Only a daily close below $101,900 would confirm a new downtrend.
Thus, the combination of on-chain and technical signals shows that Bitcoin remains fundamentally stable despite short-term fluctuations. The growing number of holders and the calm of long-term investors point to a restrained but confident accumulation. For traders, the coming weeks will be a test: will the market confirm the bulls' strength or return to a deeper correction?
Source: cryptonews.net