Three Signs of Bitcoin (BTC) Exhaustion in Late September

Bitcoin remains above $110,000, but selling pressure has increased in the last week of September.
Some on-chain metrics and macroeconomic signals warn that the BTC rally may be over. We explain what's wrong with Bitcoin.
Three warning signals
Historical data shows that September has been considered a “cursed” month for over a decade. It's consistently the weakest month of the year. As the end of the month approaches, this pattern may repeat itself as negative signals intensify.
On-chain signal: SOPR indicates declining profitability
Analyst and founder of Alphractal, Joao Vedson, noted that the Spent Output Profit Ratio (SOPR) signal points to a bearish scenario.
The SOPR shows whether Bitcoin transactions are profitable or unprofitable. A value above 1 means sellers are profitable (selling BTC above their purchase price). A value below 1 indicates a loss (selling below their cost).
At the time of writing, SOPR remains above 1 but is declining. This suggests that profits from on-chain transactions are declining.
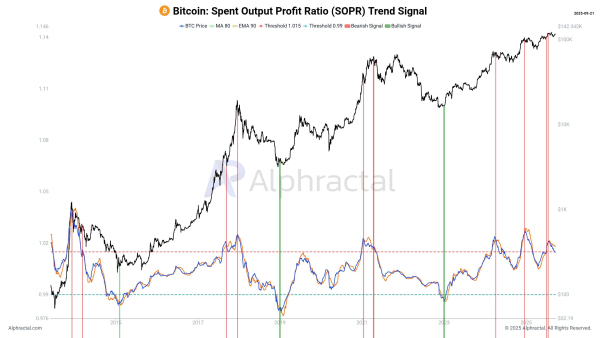 Bitcoin Spent Output Profit Ratio (SOPR). Source: Alphractal.
Historically, the red zones on the chart represent Bitcoin's peaks in past cycles. Wedson noted that investors often start buying BTC too late and at inflated prices during such periods.
“The SOPR trend signal clearly shows when blockchain profitability is declining. Never in Bitcoin history have investors bought BTC so late and at such high prices,” the expert commented.
Wedson also emphasized that the realized short-term holding price (STH) is $111,400, close to the current market level. Any drop below this threshold threatens to trigger stop-loss selling. This is concerning, as BTC already fell below this level in the last week of September.
Furthermore, despite Bitcoin's higher price compared to previous cycles, the Sharpe ratio is weaker. This means the risk-adjusted return is lower, as is the profit potential.
Signal from the exchanges: the ratio of purchases to sales is falling sharply, selling pressure is intensifying
CryptoQuant data shows that the buy/sell ratio across all exchanges has fallen below 1 in recent weeks. The 30-day simple moving average (SMA30) also follows this downward trend.
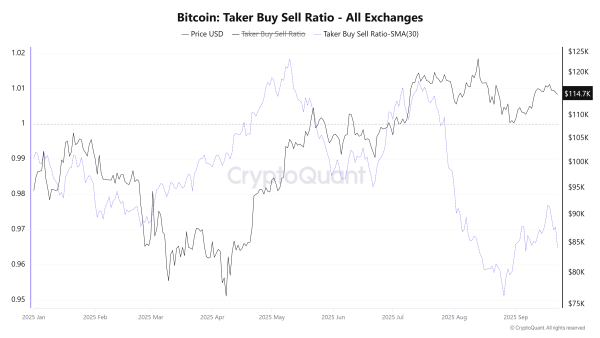 Bitcoin buy/sell ratio. Source: CryptoQuant.
The volume of active selling (taker sells) now exceeds buying, indicating negative trader sentiment. When this ratio is below 1, Bitcoin often experiences downward pressure, especially when prices are near record highs.
This indicates a weakening of the bullish momentum. Without new capital infusions, the last week of September could lead to a bearish reversal.
Macro signal from DXY
Following the Federal Reserve's recent rate cut, the US Dollar Index (DXY) has recovered, rising from 96.2 to 97.8. Some analysts warn that the inverse correlation between the DXY and BTC may return, posing downside risks to Bitcoin.
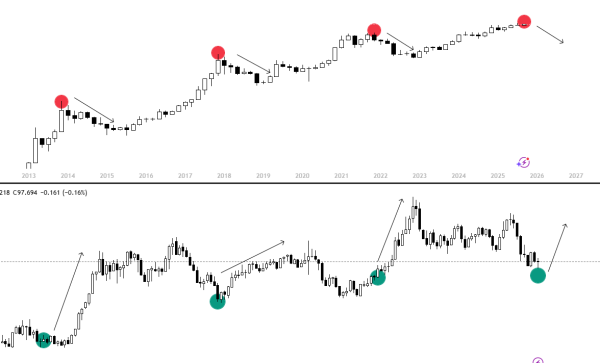 Bitcoin vs. DXY. Source: Killa.
Analyst Killa noted that if the DXY continues to rise, Bitcoin could reverse as it did in 2014, 2018, and 2021.
Three factors—on-chain, exchange, and macroeconomic signals—are exacerbating Bitcoin's “September curse.” If history repeats itself, the final days of the month will confirm it.
Source: cryptonews.net