This level of Bitcoin price determines its rise or fall
The price of Bitcoin (BTC) has plummeted this month. Since the beginning of November, the asset has lost nearly 15%. As a result, one of the year's strongest assets has become the underdog in the current correction.
This decline has once again divided the market. Some see it as the beginning of a deep correction. Others believe the cycle isn't over yet, and the current decline is just a major setback. However, the next move hinges on one level. If Bitcoin reclaims it, the rebound scenario will be activated. If not, the decline could quickly intensify.
Bitcoin Momentum: One Level to Confirm
First of all, early signs of weakening sellers are appearing.
The Relative Strength Index (RSI) entered oversold territory this week. It has since reversed, which typically indicates a reduction in selling pressure.
Moreover, the long-term pattern confirms this view. For example, from April 30 to November 14, Bitcoin's price formed a higher low. This means the global trend has not yet been broken.
However, over the same period, the RSI showed a lower low. This is a hidden bullish divergence. This signal often appears when a strong trend attempts to resume after a significant correction.
However, for this signal to be activated, Bitcoin's price must break above $100,300. This level previously served as support but now acts as psychological resistance.
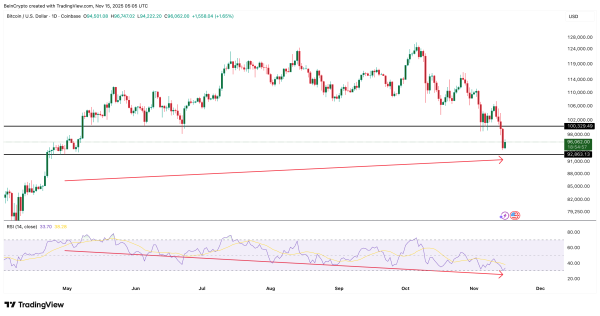 Bitcoin Sellers May Be Weaker: TradingView
On-chain supply data points to the same area. Specifically, the UTXO Realized Price Distribution indicator shows a large cluster. It formed around the $100,900 mark.
The formation of such a cluster often becomes an important decision-making point. This occurs because most of the supply has a similar cost basis. Importantly, this cluster coincides with the resistance level highlighted on the RSI chart.
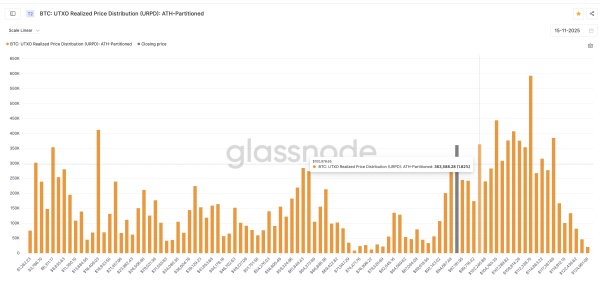 Bitcoin Supply Zones: Glassnode
That's why momentum signals only matter in one scenario: BTC's price must close above this region. Without this, divergence and oversold readings remain unconfirmed.
NUPL's Yearly Low: Chance of a Bottom Formation
The second argument in favor of a rebound comes from the NUPL (Net Unrealized Profit/Loss) metric.
NUPL has now fallen to 0.40, its lowest level in a year. Thus, the market has returned to a state of minimal unrealized profits, something similar to what was observed during the early stages of the cycle.
For example, the last time NUPL reached a comparable low was in April. Since then, Bitcoin has risen by approximately 46% in less than two months. Of course, this doesn't guarantee a repeat. But it does indicate that the market is entering a familiar pressure zone where rebounds often occur.
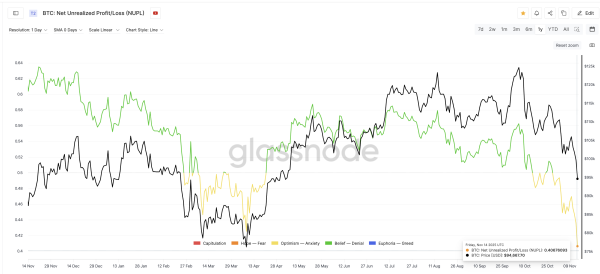 The Bottom Theory Remains Active: Glassnode
However, as in the previous case, this indicator also depends on price. The theory about the formation of a bottom remains open, but inactive.
Descending channel: two critical levels
Bitcoin remains in a descending channel, supporting a short-term bearish trend.
Therefore, the first step to the exit is simple: reclaim $100,300. A daily close above $101,600 will strengthen the move, turning the old support back into a new foothold.
If this happens, the next important level is near $106,300. A breakout of this level will break Bitcoin out of the descending channel. This action will shift the trend from bearish to neutral. It could subsequently turn bullish if momentum improves.
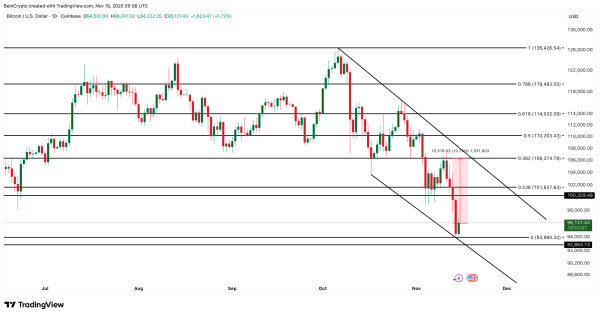 Bitcoin Price Analysis: TradingView
The risk of a crash is lower. First of all, the channel's lower boundary has only been touched twice, making it structurally weak. If Bitcoin loses $93,900–$92,800, the pattern opens the door to deeper levels. In that case, the “extended cycle” view will be much more difficult to defend.
Ultimately, it all comes down to one decision point. Above $100,300, the price will stabilize. Below $93,900, the decline could be much worse.
The post This Bitcoin Price Level Determines Its Rise or Fall appeared first on BeInCrypto.
Source: cryptonews.net