How will Bitcoin consolidation around $115,000 end?

On the evening of August 23, Bitcoin was trading around $115,000 with a market cap of $2.29 trillion and a daily trading volume of $47.99 billion. The intraday price range extended from $111,764 to $117,310, indicating consolidation after the recent sharp rise.
On the daily chart, Bitcoin appears to be consolidating near a critical support area between $111,658 and $113,000 after a strong bounce near the $124,517 swing high. A strong bearish candle marked the recent top, but it was immediately followed by a bounce off the low, supported by a significant increase in volume, indicating a bullish engulfing pattern.
The subsequent green candle with higher volume highlights the presence of buyers. However, the upside targets at $117,000 and $124,000 may face new resistance if the momentum from this level does not increase decisively.
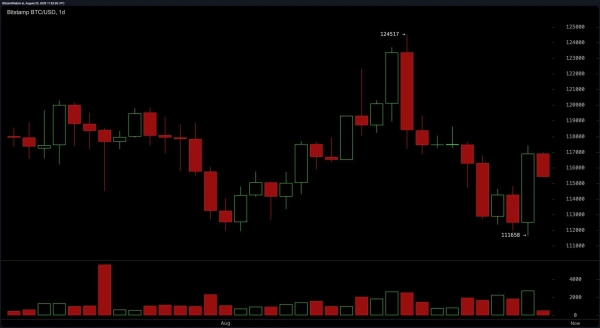
BTC/USD Daily Chart on Bitstamp for Saturday, August 23, 2025
On the four-hour chart, the leading cryptocurrency showed a V-shaped recovery from $111,658, rising to a high near $117,500 before consolidation set in. The pattern now reflects lower highs and weakening volume, indicating that bullish potential is wearing off.
However, a retest of the $112,000-$113,000 range with upper lows would confirm further gains. The immediate resistance is near $116,000, with a secondary barrier around $117,500 if the current trend structure holds.
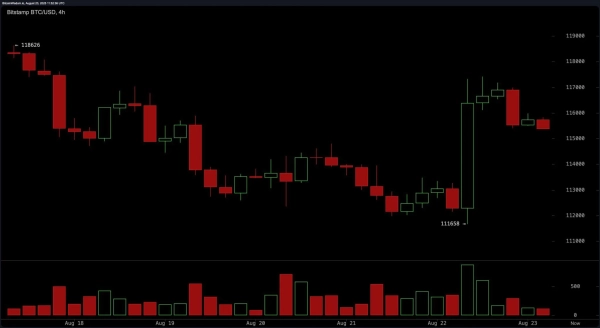
4-hour BTC/USD chart on Bitstamp for Saturday, August 23, 2025
The Bitcoin hourly chart shows the momentum following the breakout after BTC rose from $111,658 to $117,421 in a single bullish candle. The price is currently forming a pattern that could be a bull flag or an ascending triangle, which is a typical sign of strong trends continuing.
Small pullbacks on low volume indicate limited selling pressure. A confirmed break above $117,000–$117,500 on high volume could spark a rally to $118,000 and possibly $120,000 if momentum continues. A stop loss below $114,500 is recommended for short-term positions.
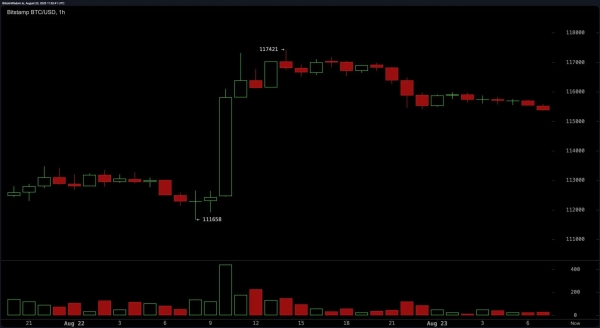
BTC/USD Hourly Chart on Bitstamp for Saturday, August 23, 2025
Oscillators are currently reflecting a cautious market sentiment. The Relative Strength Index (RSI) is neutral at 48, while the Stochastic Oscillator is at 25, also neutral. The Commodity Channel Index (CCI) is -29, indicating a lack of clear directional strength. The Average Directional Index (ADX) is weak at 17, while the Awesome Oscillator is negative at -2400, although both signals are neutral. The Momentum Indicator is at -7937, while the Moving Average Convergence Divergence (MACD) is at -281. Both signals are indicating bearish divergence.
Moving averages (MA) paint a mixed picture. Short-term moving averages such as the 10-day and 20-day exponential moving averages (EMA) and simple moving averages (SMA) are signaling negative sentiment. Longer-term indicators such as the 100-day and 200-day exponential moving averages (EMA) and simple moving averages (SMA) continue to point to buying sentiment. This divergence highlights short-term uncertainty within a long-term bullish structure, suggesting traders wait for confirmation before deciding whether to continue the trend.
Source: cryptonews.net