Bitcoin Price Falls Again – Is This Just a 'Healthy Drop'?

Bitcoin's price began a new upward wave, rising above $116,500. BTC managed to break above resistance levels at $116,800 and $117,500 before bears emerged.
A high was formed at $117,920, after which the price began a new decline. The price fell below $116,500 and $115,500. The decline accelerated after reaching $115,000. A low was formed at $114,237, and the price is now consolidating below the 23.6% Fibonacci retracement of the recent decline from the high of $117,920 to the low of $114,237.
Bitcoin is currently trading below $115,500 and the 100-hour simple moving average. Furthermore, a bearish trendline is forming on the hourly chart of the BTC/USD pair with resistance at $115,200.
The nearest resistance on the way up is near $115,000. The first key resistance is near $115,250. The next resistance could be $116,000 or a 50% Fibonacci retracement of the recent decline from the high of $117,920 to the low of $114,237.
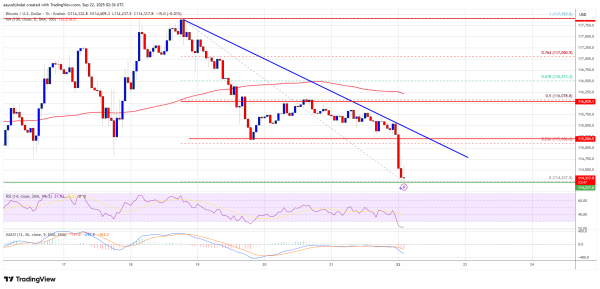
A close above the $116,000 resistance level could lead to further price gains. In this case, the price could rise and test the $116,500 resistance level. Further gains could lead to a target of $116,800. The next barrier for bulls could be $117,250.
New BTC losses?
If Bitcoin fails to rise above the $116,000 resistance zone, it could begin a new decline. The nearest support is at $114,250. The first major support is at $113,500.
The next support level is around $113,250. Further losses could lead to a near-term decline to the $112,500 support level. The main support level is $110,500, below which BTC could fall sharply.
Technical indicators:
Hourly MACD. The MACD is currently gaining momentum in bearish territory.
Hourly RSI (Relative Strength Index). The RSI for the BTC/USD pair is currently below 50.
Key support levels: $114,250, then $113,250.
The main resistance levels are $115,000 and $116,000.
Source: cryptonews.net