Bitcoin (BTC) Price Rebounds: Hodlers Give Bullish Signal

Bitcoin's price has fallen more than 6% in the past 30 days, while Ethereum has risen 16%. BTC has lost another 2% in the past week and is currently trading just below $111,000.
Let's figure out what's happening in the Bitcoin (BTC) market and what to expect from the cryptocurrency price.
BTC volume in profit close to local lows
On August 25, Bitcoin's supply-to-profit ratio fell to 88.53%, very close to the three-month low of 87.02% on June 22. The June drop triggered a rally that saw BTC rise 22% in the weeks that followed.
A similar situation occurred on August 2, when the indicator fell to 91.64% from a maximum of 98.91%. After this drop, the price of Bitcoin rose again by almost 10% in just 10 days.
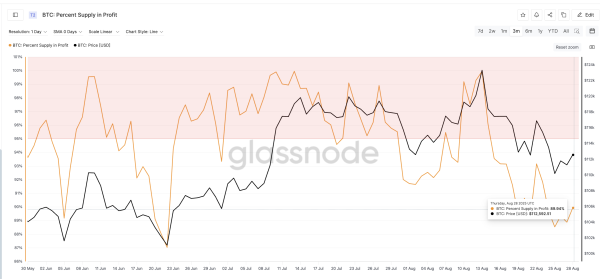 Bitcoin Price and Profit Offer: Glassnode
These examples show that when fewer holders are in the money, they have less incentive to sell. While the indicator can sometimes signal weakness or panic selling, at the time of writing it is close to levels that have previously caused strong upward moves.
Long-Term Investors Become Net Buyers of Bitcoin
A stronger signal comes from long-term investors, known as hodlers. Their change in net position shows whether they are increasing or decreasing their Bitcoin holdings each month.
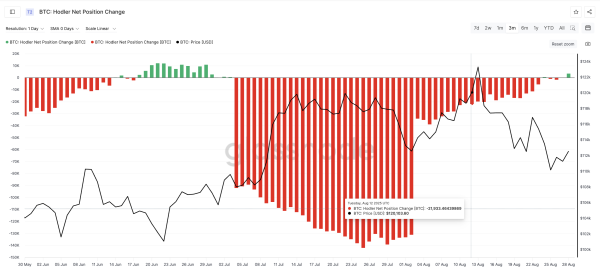 Bitcoin Price Change and HODLer Position: Glassnode
Since late July, this group has mostly stayed on the sidelines or sold, keeping the indicator in negative territory. The only short-lived green signal was on August 24, when the price jumped slightly from about $110,000 to $111,000, but selling soon resumed.
At press time, the metric had turned positive for the first time in a month, showing a gain of 3,429 BTC. This is the strongest accumulation signal since late July. When this group of long-term investors last began actively accumulating, around June 22, it coincided with the period when supply in profits reached a minimum, and Bitcoin rose from $101,084 to $123,313, a gain of 22%.
This story highlights the importance of the current changes. If investors continue to invest rather than rush to cash out, this could be the basis for new growth.
Key BTC Price Levels
At the time of publication, Bitcoin is trading just below $111,000. It has already broken through key support around $111,074, and the next support is at $110,500, with stronger protection at $108,600.
If the last level fails, the bearish scenario will strengthen and the BTC price rebound forecasts will be cancelled. This could happen if the bullish signal from HODLer weakens.
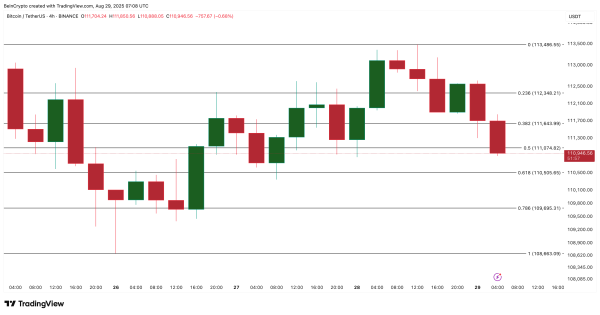 Bitcoin Price Analysis: TradingView
However, on the other hand, the situation may change. The first recovery zone is located around $113,400. If the price recovers and stays above this level, it will be a signal for a new growth of Bitcoin.
Source: cryptonews.net