Bitcoin (BTC) Price Prediction for August 24, 2025: Will BTC Break $116,200 Resistance or Pull Back to $113,000?

Bitcoin is trading around $115,100 today, having rebounded slightly after falling toward the $112,000 support level earlier this week. The rebound came after BTC broke out of a downward channel on the 4-hour chart, but the upside is currently capped by resistance around $116,000. Traders are trying to figure out whether the rebound is the start of a larger reversal or just a short-term rally.
What's Happening to the Price of Bitcoin?
 BTC Price Dynamics (Source: TradingView)
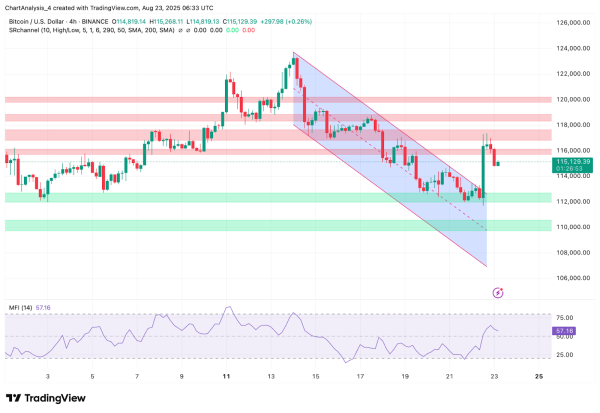
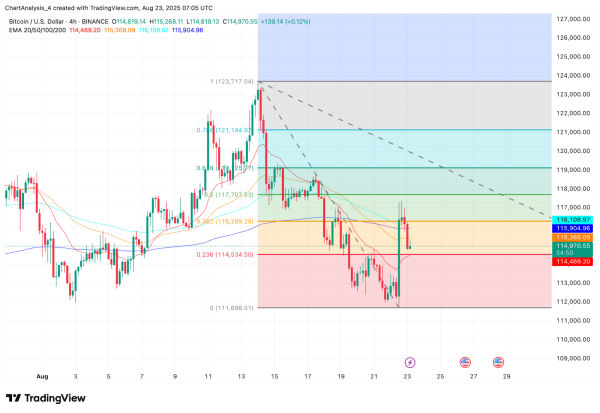
Bitcoin declined from $123,700 to $111,700 on the 4-hour chart before breaking out higher. The price action shows that the resistance at $116,200 is being tested again, which coincides with the 38.2% Fibonacci retracement level at $116,289. There has been a rebound since then, with BTC remaining just above the $114,500–$115,000 range.
The Money Flow Index (MFI) is close to 57, which means liquidity is balanced. The RSI on shorter time frames is in the range of 42 to 45, which means the market is neutral to slightly bearish. This means that momentum is starting to stabilize after last week’s decline.
 BTC Price Dynamics (Source: TradingView)
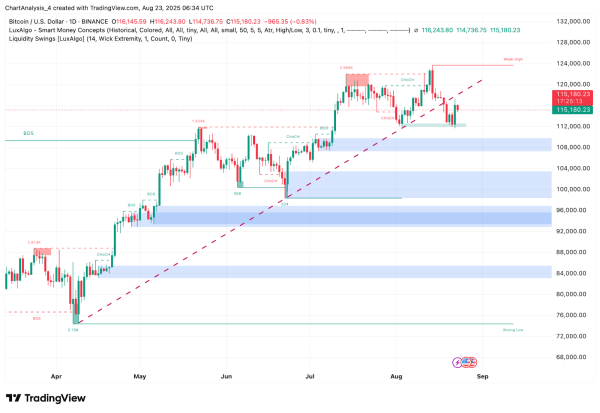
On the daily timeframe, Smart Money Concepts analysts note a breakout of the structure in the $112,000 area, where demand has softened the selling pressure. However, repeated signals of change of character (CHoCH) near $120,000 indicate that this zone has become an insurmountable obstacle for the bulls.
Why is the price of Bitcoin falling today?
The reason for today's decline in Bitcoin's price is due to both resistance pressure and derivatives flows. After a sharp intraday rise, BTC failed to hold above $116,000, and sellers re-entered the 0.382 Fibonacci zone.
 BTC Price Dynamics (Source: TradingView)
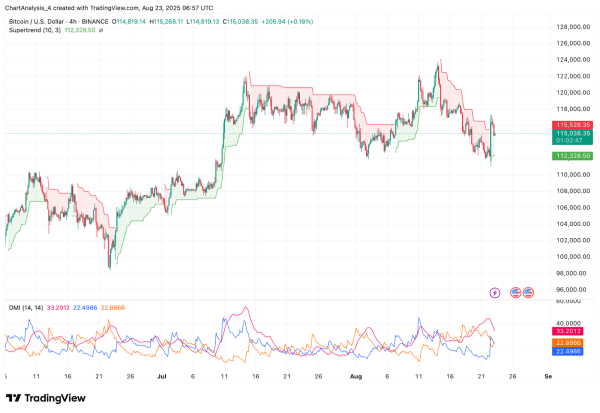
The Directional Movement Index (DMI) shows that the ADX is rising and the -DI remains above the +DI, confirming that the downward momentum still has weight. Likewise, the Supertrend resistance at $115,800 has not yet switched to a bullish trend, adding to the selling pressure.
 BTC On-Chain Analytics (Source: Coinglass)
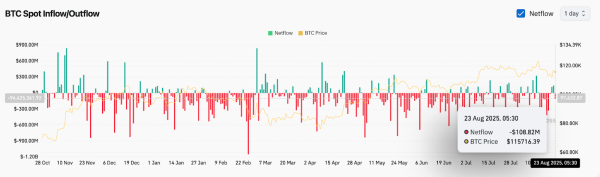
Spot flow data supports this picture. On August 23, there was a net outflow of $108.82 million, indicating capital was lost from exchanges. This supports the idea that short-term traders were taking profits as BTC stalled near resistance.
Bitcoin Price Indicators Point to Limited Volatility
 BTC Price Dynamics (Source: TradingView)
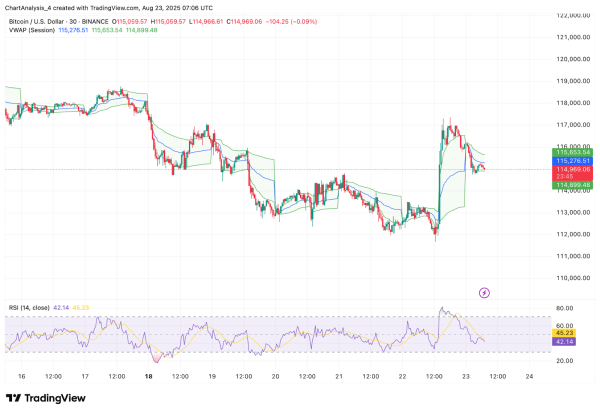
VWAP levels on the 30-minute chart show that BTC is currently trading just below the session average of $115,270, with volatility bands pointing to a sideways trend. The RSI has cooled from overbought levels and is now reading 42.14, leaving room for another bounce if buyers defend $114,500.
 BTC Price Dynamics (Source: TradingView)
Meanwhile, the exponential moving averages (EMAs) remain tightly clustered. The 20- and 50-day EMAs are just below $115,400, while the 100- and 200-day EMAs are hovering around $115,900–$116,100. This cluster reinforces the $115,800–$116,200 zone as immediate resistance. Only a solid breakout of this zone could open upside potential toward $117,700 and $119,200. Following the breakout, a Bollinger-style squeeze is in place, suggesting that Bitcoin price volatility could increase in the next 24 hours as the market determines the direction of the move.
BTC Price Forecast: Short Term Forecast (24 Hours)
In the near term, Bitcoin price is consolidating between the support level of $114,500 and the resistance level of $116,200. If buyers recoup $116,200 due to volume confirmation, the next growth targets will be $117,700 and $121,100, which coincide with the Fibonacci retracement levels.
On the other hand, if $114,500 fails to hold, BTC could fall to $113,000, followed by strong demand around $111,700. Given the neutral indicators and outflows, the bias remains range-bound with little downside risk unless $116,200 is breached.
Bitcoin Price Prediction Table: August 24, 2025
| Indicator/Zone | Level/Signal |
| Bitcoin price today | $115,129 |
| Resistance 1 | $116,200 (0.382 Fibonacci/EMA Cluster) |
| Resistance 2 | $117,700 / $121,100 (Fibonacci Targets) |
| Support 1 | $114,500 (VWAP and Fibonacci confluence) |
| Support 2 | $111,700 (base channel demand) |
| RSI (30 min) | 42.14 (neutral-bearish) |
| MFI (4H) | 57.1 (balanced) |
| DMI | -DI is leading, ADX is rising (bearish) |
| Supertrend (4H) | Bearish trend below $115,800 |
| Spot Flows (August 23) | -108.82 million US dollars (outflow) |
Source: cryptonews.net