Dogecoin Markets Ignite: Elon Musk’s ‘Dogefather’ Memes Spark FOMO Frenzy – Markets and Prices Bitcoin News

Dogecoin (DOGE) keeps climbing on Dec. 7, 2024, as technical data from its 1-hour, 4-hour, and daily charts point to persistent bullish energy. Adding to the buzz, interest has spiked thanks to DOGE-related posts shared by Elon Musk on X.
Dogecoin
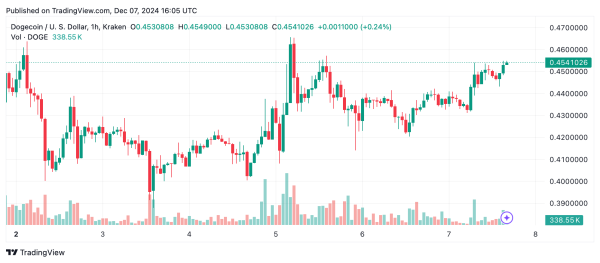
The 1-hour chart highlights a robust uptrend for dogecoin (DOGE), with the price rebounding from $0.42 and peaking at $0.454. This movement was accompanied by a significant volume spike, signaling strong buying interest. However, some profit-taking led to a slight decrease in volume, suggesting a potential retracement. An entry near $0.445 or $0.44 during lower sell volume periods could provide an advantageous position, with short-term targets at $0.46 to $0.47.

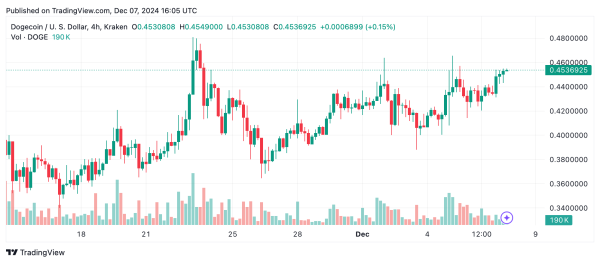
On the 4-hour chart, dogecoin exhibits a pattern of higher highs and higher lows since December 3, solidifying its medium-term bullish trend. Support around $0.42 has been reinforced, with resistance identified between $0.46 and $0.47. Green volume candles during upward movements indicate significant buying, likely by institutional investors. Traders may find attractive entry opportunities near $0.435 to $0.44 and could target $0.4655 to $0.47 or higher if resistance levels are breached with strong volume.

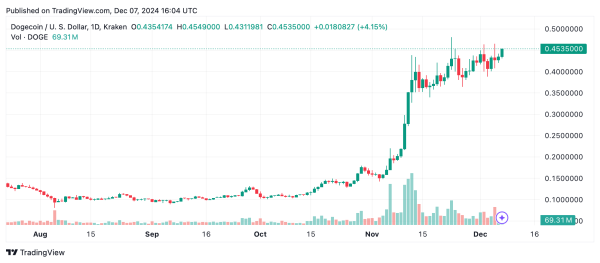
Dogecoin’s daily chart reveals a strong recovery from $0.1422 in November to a peak of $0.48 in December. The consolidation zone between $0.44 and $0.45 highlights bullish strength, with a potential breakout on the horizon. Major resistance at $0.48 remains a crucial level; a daily close above this could lead to targets of $0.50 or more. Key support levels are seen at $0.42 to $0.43, which offer strategic entry points for long-term positions.

Oscillators provide a mixed outlook, with the relative strength index (RSI) at 68.2 and stochastic at 67.4, both indicating neutrality. The momentum indicator suggests an optimistic signal, while the moving average convergence divergence (MACD) level reflects a sell bias. On the other hand, moving averages (MAs) are unequivocally bullish, with exponential moving averages (EMAs) and simple moving averages (SMAs) across 10-, 20-, 50-, and 200-period ranges signaling buy actions, reinforcing the bullish sentiment.

Dogecoin’s immediate resistance levels lie between $0.46 and $0.47, while $0.48 represents a strong barrier. On the downside, support levels at $0.44 and $0.42 provide a safety net.

A breach below $0.42 on higher volume could signal a reversal, warranting tight stop-loss strategies. Overall, dogecoin presents a promising technical setup, making it a favorable asset for traders seeking bullish opportunities.
Bull Verdict:
Dogecoin’s price action on December 7, 2024, strongly favors a bullish scenario. The confluence of higher highs, supportive volume trends, and buy signals from moving averages across all timeframes suggest further upside potential. If the price sustains above $0.46 and breaks through the $0.48 resistance, DOGE could aim for $0.50 or higher, reinforcing its bullish momentum.
Bear Verdict:
Despite dogecoin’s upward movement, caution is warranted. Oscillators such as the relative strength index (RSI) and moving average convergence divergence (MACD) level reveal mixed signals. A failure to hold support at $0.42 or a rejection at $0.48 with rising sell volume could signal a reversal, exposing DOGE to downside risks toward lower support zones.


