Bitcoin Price Analysis: The Battle for $100K Inches Closer – Markets and Prices Bitcoin News

Bitcoin is currently priced at $98,689, with a market capitalization of $1.95 trillion, a 24-hour trading volume of $29.58 billion, and an intraday price range between $95,426 and $98,900, showing signs of consolidation across multiple timeframes.
Bitcoin
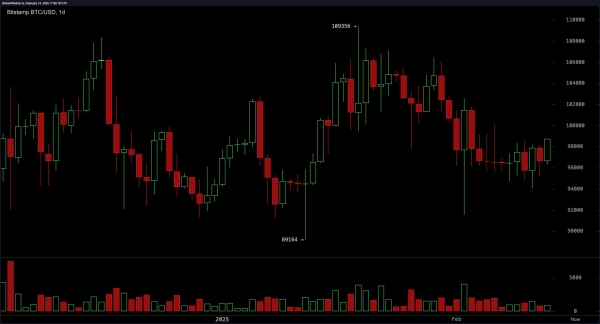
Friday’s daily chart shows that bitcoin (BTC) recently reached a high of $109,356 before experiencing a strong pullback, establishing support at $89,164, and recovering into a consolidation range between $96,000 and $98,500. This suggests that the asset is stabilizing after a period of volatility, with buyers stepping in at lower levels while resistance remains untested near $100,000. The price action reflects a balance between demand and supply, as traders assess the next directional move.

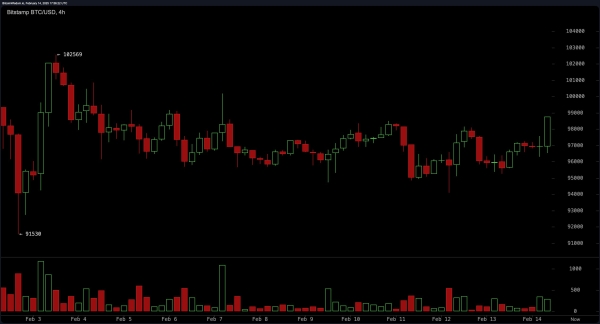
On the 4-hour chart, bitcoin remains in a sideways consolidation pattern with intermittent uptrends and downtrends. Resistance is currently identified at $102,569, while local support is holding around $91,530. The recent movement suggests a slight upward bias, but the price remains confined within a trading range. Until a breakout occurs, price action within this timeframe remains neutral, and traders will look for volume and volatility expansion to confirm a stronger directional move.

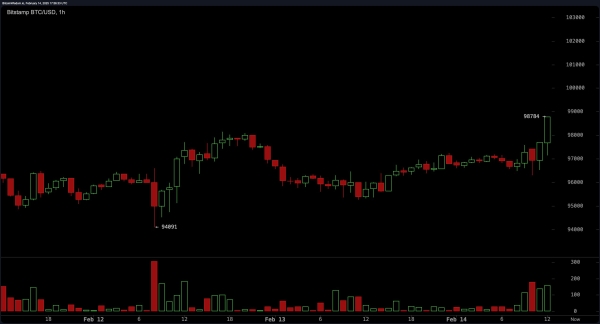
Bitcoin’s price on the 1-hour chart highlights a more immediate bullish trend, with bitcoin reaching $98,784 after rebounding from a recent low of $94,091 per unit. Bullish candlestick formations suggest growing momentum, though the price remains near key resistance levels. A confirmed breakout above $99,200 could trigger further upside toward $100,000, while failure to hold above this level could result in a retest of lower support zones.

Oscillators present mixed signals, with the relative strength index (RSI) at 49.5, the Stochastic at 46.7, the commodity channel index (CCI) at -36.6, the average directional index (ADX) at 28.0, and the awesome oscillator all indicating a neutral stance. Momentum is one of the few bullish indicators at 763.0, while the moving average convergence divergence (MACD) level is bearish at -880.8. These readings suggest that while upward momentum is present, confirmation from volume and price action will be needed for a sustained move.
Moving averages also provide conflicting signals, with the 10-period exponential moving average (EMA) at $97,663.9 and the 10-period simple moving average (SMA) at $96,895.2 indicating buying pressure. The 20-period EMA at $98,502.5 supports this trend, while the 20-period SMA at $99,168.0, the 30-period EMA at $98,797.8, and the 50-period SMA at $98,711.0 indicate potential selling pressure. Long-term moving averages, such as the 100-period EMA at $93,674.5 and the 200-period EMA at $84,547.6, suggest that the broader trend remains bullish, as the price continues to trade above these key support levels.
Bull Verdict:
Bitcoin remains in a consolidation phase, but the 1-hour and 4-hour charts indicate a potential breakout if price action holds above $98,800. Strong support from multiple moving averages, combined with bullish momentum on the shorter timeframes, suggests that a move toward $100,000 and beyond is possible. If bitcoin maintains higher lows and breaks key resistance at $102,500, further upside toward previous highs near $109,356 could be in play.
Bear Verdict:
Despite recent price stability, oscillators remain largely neutral, and resistance levels near $99,000 and $100,000 could cap upside movement. The 20-period and 30-period moving averages suggest selling pressure, and failure to hold support at $96,000 could lead to a breakdown toward $94,000 or even $91,500. If volume fails to support a breakout and price loses key short-term levels, a retest of $89,164 may become a realistic downside target.


