Bitcoin News: BTC Bull Market Is Far From Over, Historical Trends Tied to 200-Week Average Suggest
Past trends associated with the 200-week SMA suggests the ongoing range play between $90K and $110K will likely resolve bullishly.
Feb 14, 2025, 7:19 a.m. UTC
What to know:
- BTC's 200-week SMA remains well short of the price high registered during the 2021 bull market.
- Past data show bull markets tend to peak with the average rising to the record prices established in the prior bull run.
Historical trends tied to a key indicator suggest that bitcoin (BTC) has plenty of upside left as renewed inflation in the U.S. threatens to challenge the current uptrend.
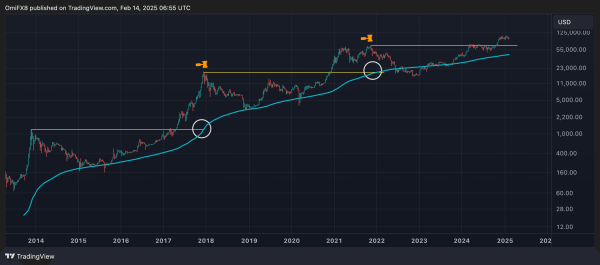
The 200-week simple moving average (SMA) of bitcoin's price, which smooths out short-term market fluctuations to provide a clearer picture of the overall trend, stood at $44,200 at the time of writing, according to TradingView.
Although this average is at its highest point ever, it is still significantly below the previous bull market's peak of $69,000 in November 2021.
That may be an important point because past data show bull markets end with the 200-week SMA rising to the record prices established in the preceding bull run.
For instance, the previous bull market ended in late 2021 with the 200-week SMA rising to $19,000, the 2017 bull market peak. Similarly, the bull market of 2017 ended in December of that year, with the 200-week SMA rising to the record price of over $1,200 set four years ago.
If past trends hold true, bitcoin's current range between $90,000 and $110,000 will likely resolve bullishly, paving the way for the next upward movement.
The pricing of options on Deribit supports the bullish outlook offered by the 200-week SMA. For example, according to data source Amberdata, options with expirations of three months or longer show that call options are more expensive than put options, indicating a market expectation of rising prices.
Further, most open interest is concentrated in call options at strikes higher than BTC's going market price of $96,700. As of writing, call option at the $120K strike was the most popular, boasting a notional open interest of over $1.8 billion, reflecting bullish expectations. Open interest refers to the number of contracts active or open at a given time.