Bitcoin Price Prediction: BTC Falls as BlackRock Triggers $1B Selloff

- BlackRock's $1 billion Bitcoin sale deepens the bearish trend below the key $106,000 support level.
- The rise in open interest to $73 billion indicates confidence, but increases liquidation risks.
- Strong currency outflows indicate long-term accumulation despite short-term weakness.
Bitcoin remains under intense selling pressure, failing to hold key support levels near $106,000. The world's largest cryptocurrency continues to decline amid intensifying institutional moves. Earlier today, BlackRock reportedly sold approximately 9,000 BTC, worth approximately $1 billion. This significant selloff has intensified the bearish momentum that began after Bitcoin rebounded from its peak of $126,000 earlier this month.
🚨 BREAKING:
BLACKROCK JUST STARTED SELLING BITCOIN!
TODAY ALONE, THEY DUMPED $9,000 BTC WORTH $1 BILLION.
WHAT'S GOING ON?? pic.twitter.com/qYnsbW8JGs
— 0xNobler (@CryptoNobler) October 17, 2025
Market trends and technical forecast
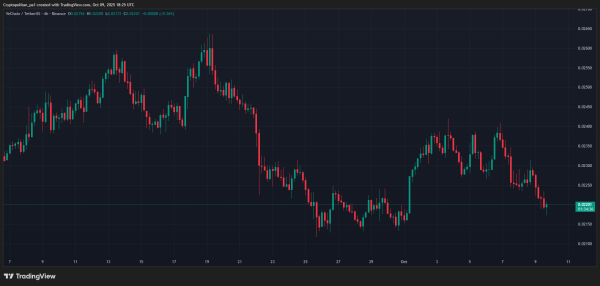
The 4-hour Bitcoin chart shows a consistent pattern of lower highs and lower lows, indicating a clear downtrend. The asset is currently trading below all major exponential moving averages (20, 50, 100, and 200), confirming both short- and medium-term bearish sentiment.
The nearest resistance lies between $110,000 and $113,000, where the 20-day EMA and the 0.236 Fibonacci level coincide. If the price fails to break this zone, it could push it towards $102,000.
 BTC Price Dynamics (Source: TradingView)
Moreover, the 0.382 to 0.5 Fibonacci retracement range between $113,000 and $116,000 is densely packed with resistance from higher exponential moving averages (EMAs). A sustained reversal would require a close above $118,000, and the 0.618 Fibonacci retracement level would signal a sustained reversal. Meanwhile, $105,927 remains a critical short-term support level. A decisive break below this level could accelerate the decline to $100,000.
Investor behavior and activity in the derivatives market
Despite the correction, activity in the Bitcoin futures market remains high. Open interest has grown steadily throughout 2025, increasing from less than $20 billion in January to over $70 billion by mid-October.
 Source: Coin Glass
As of October 17, total open interest stood at $73.19 billion, reflecting increased speculative activity. This level of leverage often indicates trader confidence, but it also increases the risk of liquidation in the event of a sharp price drop.
Currency flows indicate long-term holding
 Source: Coin Glass
Bitcoin exchange inflow and outflow charts show that outflows have been dominant since February. Large withdrawals in April, June, and early October indicate that many investors are opting for self-custody rather than storing their Bitcoin on an exchange. On October 17, an outflow of $209 million was recorded, while prices hovered around $105,864. This trend indicates long-term accumulation, despite short-term price declines.
Bitcoin Price Technical Forecast
Key levels will remain clearly defined by the end of October:
- The nearest resistance levels are $110,700 (0.236 Fibonacci retracement), $113,700 (0.382 Fibonacci retracement), and $116,100 (0.5 Fibonacci retracement). A break of these levels could lead to $118,500 and $121,900 , where the 0.618 and 0.786 Fibonacci retracement levels coincide with the long-term moving averages.
- Downside levels: The immediate support is near $105,900 , followed by $103,000 and $102,000 , which define the lower boundary of the recent consolidation range. A sustained break below $102,000 could trigger a deeper pullback to the psychological support of $100,000 .
- Resistance ceiling: The 200 EMA near $115,300 remains a key level for any medium-term bullish reversal.
The technical picture shows Bitcoin is squeezing in a downward channel, signaling increasing volatility ahead of the next decisive move.
Will Bitcoin recover or continue to correct?
Bitcoin's October price forecast hinges on whether bulls can hold the $105,900–$103,000 demand zone long enough to recoup short-term exponential moving averages (EMAs). A strong close above $111,000–$113,000 could confirm a short-term recovery targeting $118,500.
However, a sustained break from the 20-50 EMA cluster will confirm the continuation of the bearish structure. Increased open interest and institutional selling, including BlackRock's $1 billion liquidation, point to increased volatility ahead. Bitcoin is currently in a critical situation, and holding the key support level could trigger a rebound, but a decline would pave the way for another decline toward $100,000.
Related: Dogecoin Price Prediction: Musk's Tweet Fuels Hype Again, But Resistance Remains
Source: cryptonews.net