Bitcoin (BTC) Targets $100,000-$107,000 Support Zone Amid Mass Liquidations
The crypto market has seen massive liquidations over the past three months, with long and short positions with low and medium leverage being wiped out. BTC has not escaped this fate
The latest liquidations of BTC positions show that there is no clear leader in the current market. It is mainly driven by a two-sided hunt for liquidity.
Bitcoin Mass Liquidations
Alphractal data with a liquidity threshold filter of 50% shows only areas with high liquidity concentration. This indicates that the price was actively looking for large clusters of orders to close positions.
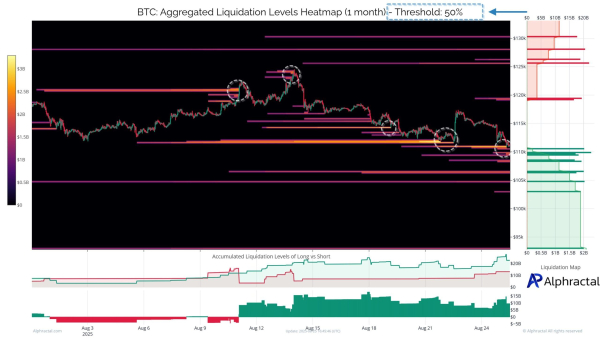 BTC Liquidation Map. Source: Alphractal
For Bitcoin, the most notable feature was the formation of a large cluster of long positions in the $104,000–$107,000 region. This zone of concentrated liquidity echoes the $100,000–$107,000 support zone that analyst Axel Adler Jr. identified based on on-chain data.
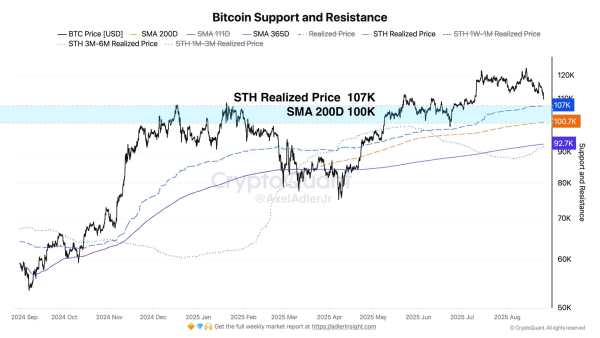 Bitcoin on-chain data. Source: Axel Adler Jr.
This level marks the intersection of the realized short-term holders' price (the average cost for short-term investors) and the 200-day moving average. This reinforces the reliability of this support zone. Experts believe that if this area is broken, a pullback to the $92,000-$93,000 range is possible.
“The immediate strong support zone is in the 100-107k range where the STH realized price and the 200D SMA intersect. Below that, additional support is in the 92-93k area. This represents value for short-term investors who have held coins for 3-6 months. This will be a key second line of defense if the market loses the 100-107k level,” said Axel Adler Jr.
As BeInCrypto reported earlier, the Bitcoin spot market is dominated by selling, highlighting the weakening demand and the risk of a fall towards the support level at 107,557.
Key barrier for BTC is at $108,800
On the other hand, the $108,800 level is the boundary between the bull and bear markets. According to Murphy Chen, this is a short-term cost for investors. A sustained close above this threshold will signal a reduction in selling pressure. However, a loss of this level could trigger a short-term sell-off.
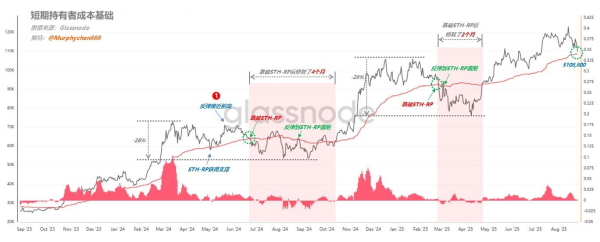 The Bull-Bear Market Boundary and STH-RP Price Dynamics. Source: Murphy Chen
In other words, the $108,800 area is a major crossroad that will determine whether Bitcoin continues to rise or starts a deeper correction.
“Currently, the $108,000 level is a 13% drop from the maximum. If the STH-RP line is broken, another 10-15% drop is theoretically possible. In the absence of major negative events, the correction amplitude should not exceed the value observed the previous two times,” Murphy Chen noted.
Over the past three months, the market has liquidated 94% of accounts. This highlights the risks of trading with high leverage in a liquidity hunt. Trading near large clusters of liquidity often involves high risk. This increases the importance of defensive strategies such as stop-loss placement and position management.
Source: cryptonews.net