Bitcoin Technical Analysis: BTC May Test $95K Again With Long Wicks At 200-DMA Support
Signs of seller exhaustion on the 200-day simple moving average suggest a price rebound is likely.
Updated March 5, 2025, 18:10 UTC Published March 5, 2025, 10:25 UTC

What to consider:
- Technical charts are showing bullish signals for Bitcoin at a major support level, implying a possible reversal in the market.
- Bitcoin's decline has slowed at the 200-day simple moving average support level, with signs of easing selling pressure.
- Resistance is expected at $95,000 and then at $100,000.
Technical charts, especially candlestick patterns, often reflect market psychology, highlighting traders’ sentiment and actions. Since Friday, at least two Bitcoin (BTC) candlesticks have indicated bullish undercurrents at multi-month lows, giving crypto investors hope.
The chart below shows that BTC's price decline has stalled at the 200-day simple moving average support level from last Wednesday. The daily candles for Tuesday and Friday are particularly interesting as both have small bodies with long lower wicks, suggesting bearish failures below the 200-day simple moving average.
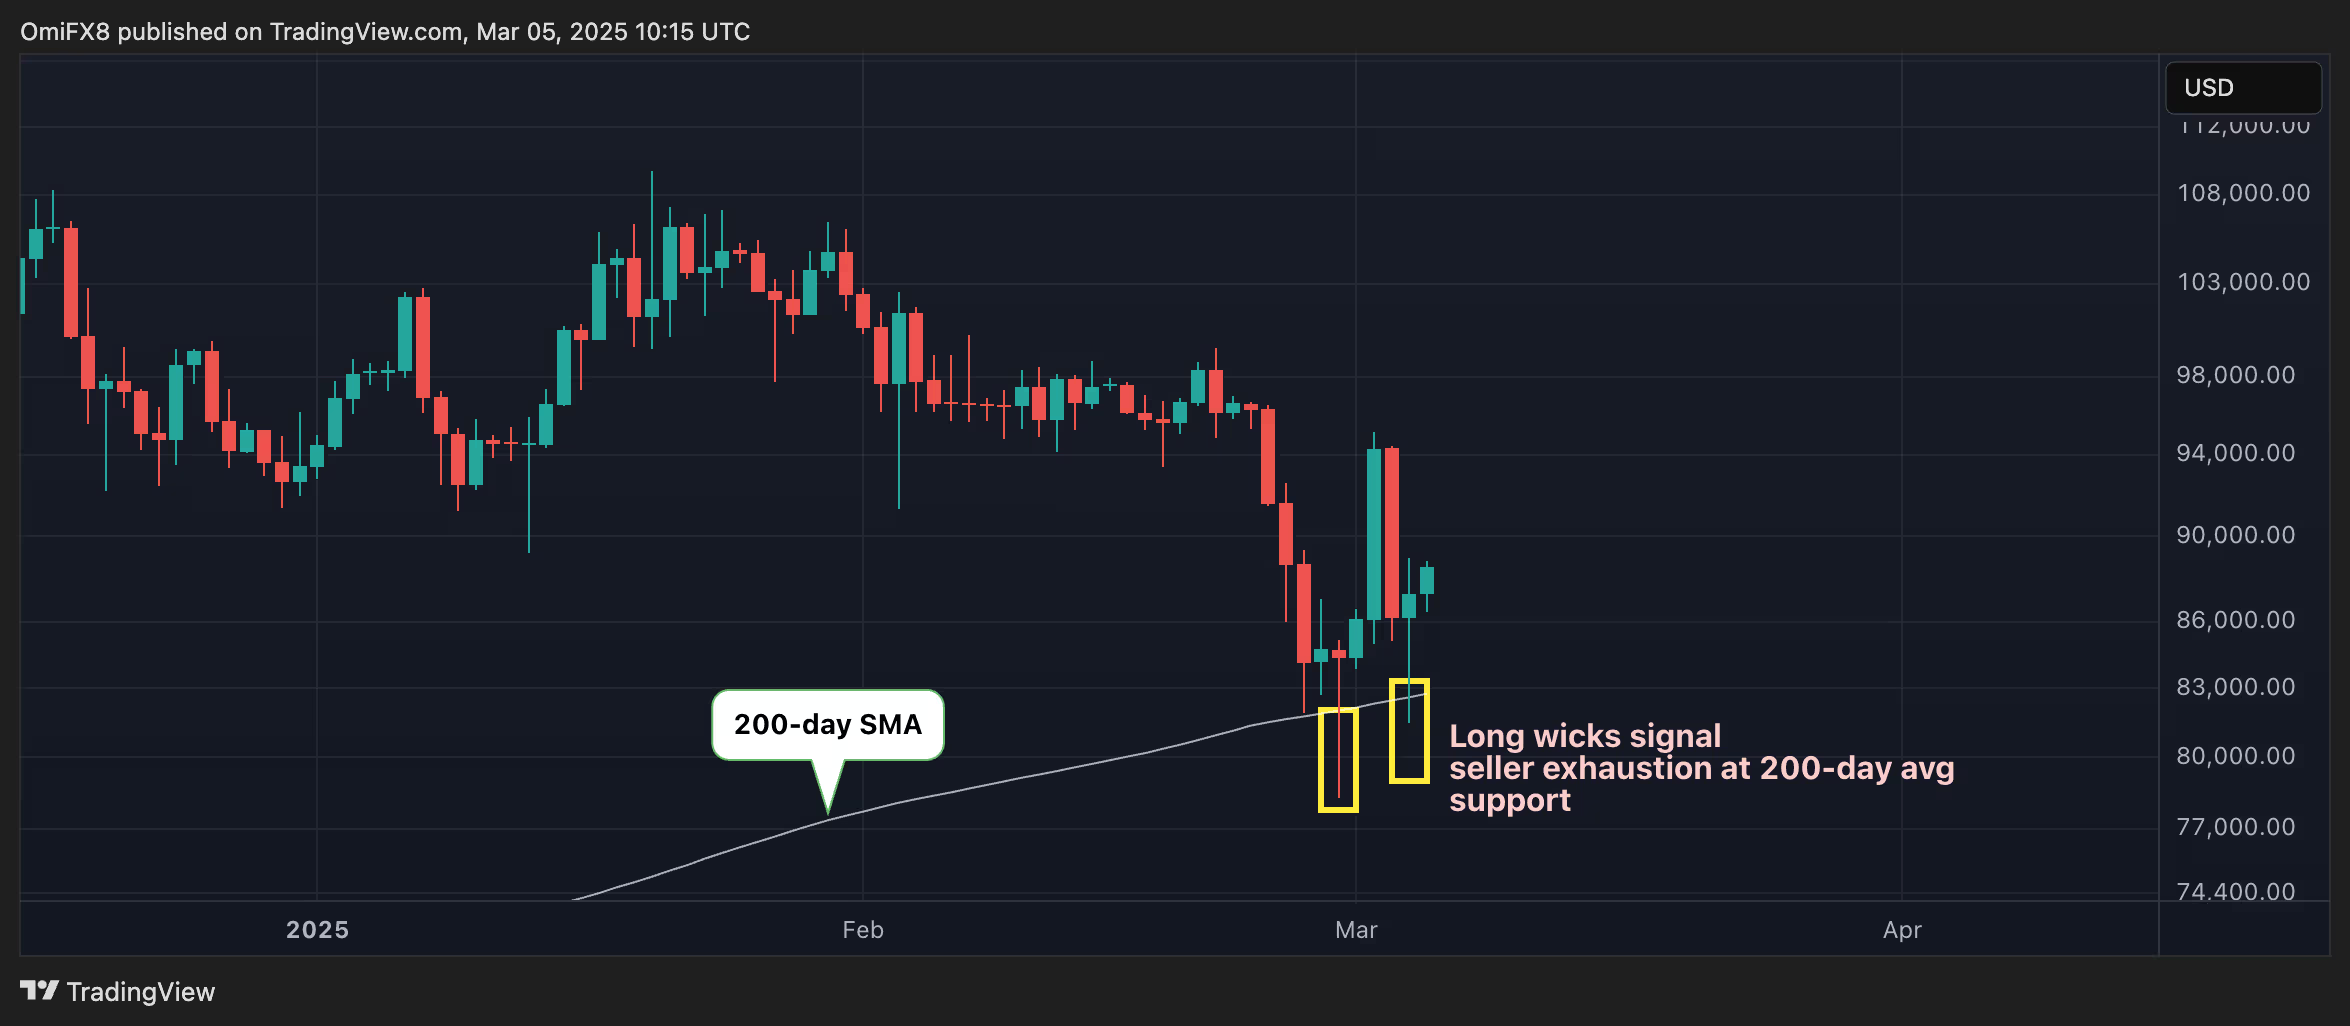
In other words, on both days sellers initially pushed prices below the key average level but failed to hold there, likely due to buyers intervening to defend the support level.
Such candles, occurring after a significant downtrend, as in the case of BTC, signal a possible bullish reversal. Traders usually take this as an indication that selling pressure is easing, which may lead to a resumption of the bullish trend.
Thus, BTC could return to Sunday's peak around $95,000, above which traders could target $100,000 again. Otherwise, a break below the 200-day SMA could result in more serious losses.