Bitcoin Price Risks Further Fall as Correlation with Nasdaq Becomes One-Way: Wintermute

Bitcoin is showing signs of fatigue despite trading above the psychological $100,000 level.
According to a November 13 report from market maker Wintermute, the world's largest cryptocurrency is reacting more strongly to declines in the Nasdaq-100 index than to gains. This is a bearish trend, indicating investor fatigue rather than euphoria.
Bitcoin reflects Nasdaq's problems, not its successes.
Wintermute notes that Bitcoin's correlation with the Nasdaq remains high at around 0.8, but Bitcoin's reaction to changes in the stock index has changed. When stocks fall, Bitcoin typically falls more sharply. When stocks rise, Bitcoin's reaction is muted.
This pattern, known as the “negative productivity distortion,” was last observed during the 2022 bear market. It often indicates resource exhaustion at market bottoms rather than strength at market tops. The report identifies two main reasons for this shift.
You may also like: Bitcoin Price Prediction: Calm Before $200,000 Breakout?
First, institutional and retail capital has shifted away from cryptocurrencies as investors' attention has shifted to large-cap tech stocks. Second, cryptocurrency liquidity has declined due to a slowdown in stablecoin issuance, a decline in ETF inflows, and insufficient market depth.
When stocks fall in price, these factors amplify downward movements, making Bitcoin more sensitive to negative news than positive news.
Despite this, Bitcoin performed better than expected, falling less than 20% from its peak, indicating continued confidence in the asset's long-term resilience despite subdued sentiment.
Bitcoin Price Technical Forecast
Bitcoin is trading at $103,615 with moderate buying activity. The digital asset is below the midline of the Bollinger Bands, indicating cautious market sentiment. Most moving averages indicate a slight bearish bias, but the relative strength index, close to 43, indicates neutral momentum.
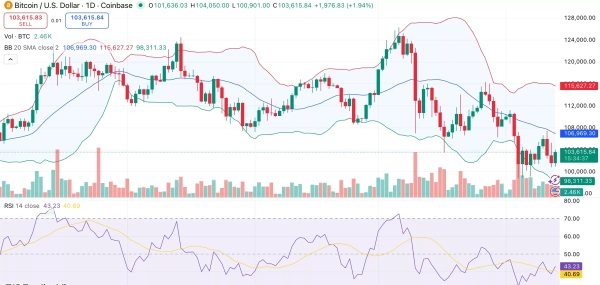 Bitcoin daily chart. Source: crypto.news
Momentum indicators are giving mixed signals. While the MACD indicates selling pressure, the Momentum (10) indicator is sending a buy signal, suggesting a potential short-term rebound if sentiment stabilizes.
Short-term resistance lies at $107,000, indicated by the 20-day simple moving average, and support lies near the lower Bollinger Band at $98,000. A strong close above $107,000 could open the door to $110,000, but if the price fails to hold at $100,000, it could lead to a more significant correction.
Source: cryptonews.net