Bitcoin Price Falls Below $112,000: Analysts Expect Decisive Move

Bitcoin showed volatility on August 21, when the price fell to $111,972 on the Bitstamp exchange, below the psychologically important level of $112,000. At the time of writing, the quotes have recovered to $113,042, with experts actively discussing further prospects for the movement.
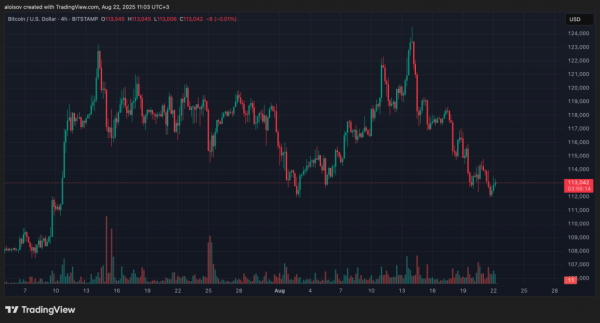 BTC/USD 4-hour chart. Source: Bitstamp
Key levels
Trader Daan Crypto Trades points out that Bitcoin has been moving sideways for the last 2-3 days. At the same time, open interest in futures is growing, indicating that market participants are accumulating both long and short positions.
The expert identifies $111,000 and $114,000 as key levels for short-term trading. A breakout of one of them can determine the direction of further movement.
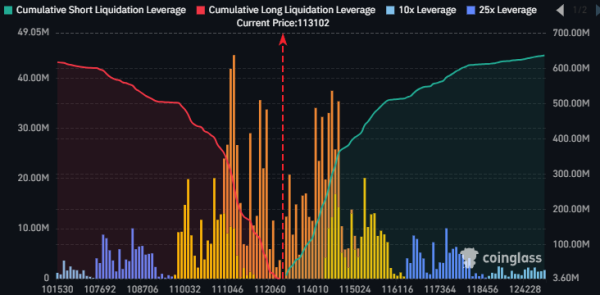 Bitcoin Futures Position Liquidations Chart. Source: Daan Crypto Trades
Indian analyst Crypto Candy also focuses on technical analysis: “Bitcoin has dropped to the $110,400-$111,900 zone and is trying to bounce back from there. If the momentum continues, we may see a move towards the $115,000-$116,700 zone or higher.”
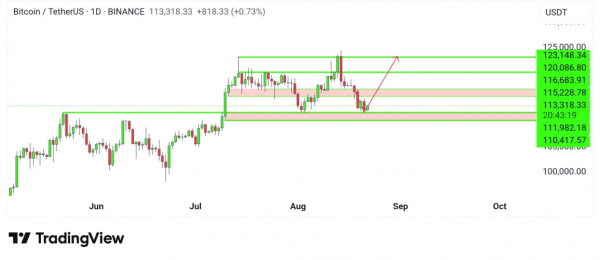 1-day chart BTC/USDT. Analytics: Crypto Candy
Awaiting Fed Chairman's Speech
Crypto trader and analyst Michaël van de Poppe notes on the X social network that Bitcoin has updated its latest minimum, but has not yet touched all the lows. In his opinion, the current period is characterized by particular complexity for traders.
“Wouldn't be surprised to see volatile moves in both directions to liquidate all positions before the real move begins. Typical behavior before a Fed event,” the analyst wrote, referring to Federal Reserve Chairman Jerome Powell's upcoming speech at the Jackson Hole Symposium, which will take place today at 17:00 Moscow time. He believes that the current area is suitable for accumulating positions.
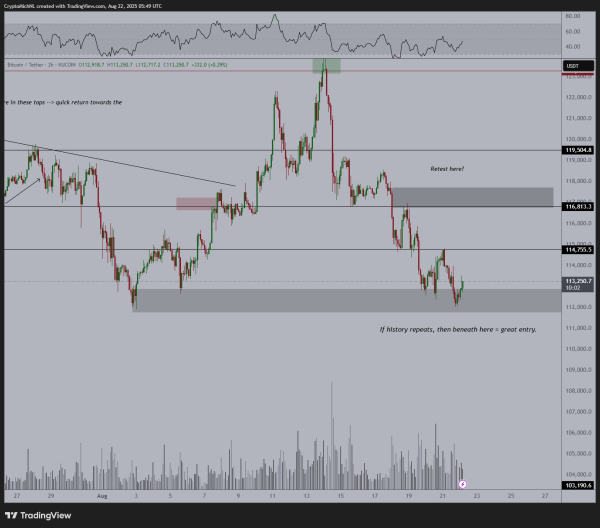 BTC/USDT 2-hour chart. Analysis: Michael van de Poppe
Historical analysis reveals patterns
Rekt Capital analyst has provided a detailed comparison of the current cycle with previous periods of Bitcoin growth. His research shows interesting patterns in price behavior during the “price discovery” phase – the period when new historical highs are established.
In the 2013 cycle, Bitcoin rose for 6 weeks in a row, then the first significant correction occurred in the 7th week. The 2017 cycle showed 7 weeks of growth followed by a 34% pullback in the 8th week. The 2020/2021 cycle showed 6 weeks of growth and a 30% correction.
The current 2025 cycle shows similar dynamics: 7 weeks of growth in the first phase of price discovery, then a 32% correction. Bitcoin is currently in the 6th week of the second phase of price discovery, when the pullback began.
“Weeks 6-8 in the price discovery phase are clearly problematic for Bitcoin. However, after that, there are excellent opportunities for growth,” the analyst concludes.
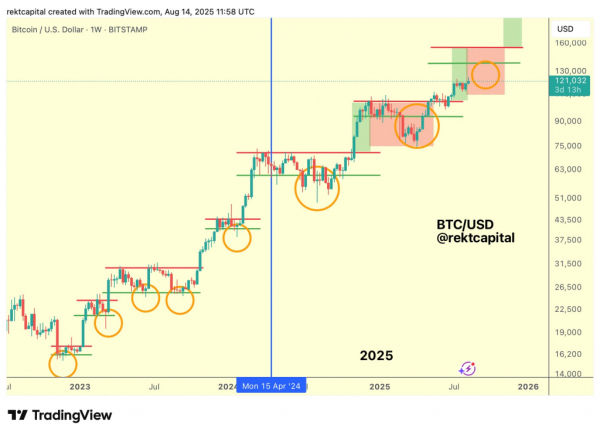 1-week chart BTC/USDT. Analytics: Rekt Capital
The community believes in growth to $150,000
Analytics platform Santiment is conducting a survey among users on when Bitcoin will reach the $150,000 mark. At the current price of $112,600, the results showed optimism from the community: 59% of respondents expect this level by the end of 2025, 20.1% – in the period 2026-2027.
Only 12.4% of survey participants believe that Bitcoin will not reach $150,000 before 2028, while 8.6% believe that such a price is unattainable.
Technical analysis shows that Bitcoin is in a critical zone where the short-term direction will be determined. Historical data suggests that the current period of volatility may precede a new upside momentum.
Source: cryptonews.net