Dogecoin (DOGE): What investors need to know now

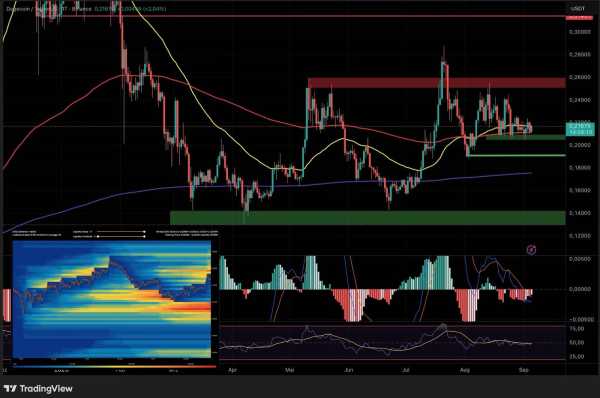
Dogecoin continues to move in a pronounced consolidation phase on the daily chart. Despite a lack of momentum, the price is managing to hold above the central support zone. This zone acts as a crucial short-term defensive line, determining whether the buyers can maintain their position or whether a corrective movement gains momentum.
A look at the heatmap (bottom left in the chart below) shows that liquidity is increasingly accumulating below the current price level. This pattern indicates that a potential downward sell-off could trigger larger order blocks. Such movements often occur when accumulated positions are liquidated in a short period of time, accelerating market movement.
The indicators paint a mixed, yet rather neutral picture. The MACD (Moving Average Convergence Divergence) signals that downward pressure is gradually easing and the negative momentum is diminishing. This suggests a potential stabilization. In parallel, the RSI (Relative Strength Index) is moving sideways without reaching extreme levels, supporting the assumption of continued consolidation rather than indicating an impulsive trend movement.
The current situation thus suggests that Dogecoin is in an intermediate phase. The existing support has so far prevented any significant declines, but at the same time, there is a lack of buying volume to initiate a new uptrend. The decisive factor will be whether the support zone can be sustainably defended. In this case, a gradual bottoming out could begin. Should the zone break, however, an accelerated downward movement is likely.
4-hour chart focuses on resistance and possible directional decision
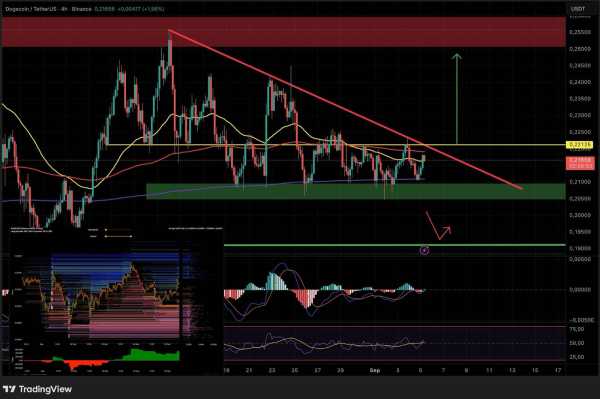
The situation becomes even clearer on the 4-hour chart. The liquidation levels (bottom left in the chart below) show that more long positions than short positions have been built within the current price range, revealing a clear long delta.
Learn crypto trading in a video course. In the BTC-ECHO Academy, Bastian (Bitbull) explains what's important in crypto trading and which strategies he uses to achieve success. Watch now.
From a technical perspective, Dogecoin is at a crucial milestone. If it fails to hold above the yellow resistance line and the diagonal trend line running above it, a pullback is imminent. In this case, the ascending triangle visible in the chart would resolve downwards, which could very likely lead to a drop into the green support box.
The opposite scenario arises with an upside breakout. If the resistance is successfully overcome, the price could gain direct momentum toward the red resistance zone. This would determine whether the buyers can generate sufficient momentum to finally exit the consolidation phase and initiate a new uptrend.
About the author
Bastian Keller (Bitbull) has been operating independently in the forex market since 2015 and has been a full-time trader in the crypto market since 2018. He actively shares this expertise on various social media platforms, particularly on his YouTube channel “Bitbull Trading,” which has more than 125,000 subscribers. Bitbull has also launched the TradeMania platform, which is designed to make it easier for beginners to get started in crypto trading.
Recommended Video Bitcoin weak and gold stronger than ever – Is this the opportunity?