CleanSpark Q1 FY25 Earnings Analysis: Strong Execution, But Shares Underperform

CleanSpark delivered impressive financial results for the quarter, but its market metrics did not show similar strength. This analysis looks at key financial metrics, operating data, and strategic directions to get a complete picture.
CleanSpark Review: Efficient Execution Amid Market Uncertainty
This guest post is published on Bitcoinminingstock.io, a one-stop resource for all things Bitcoin mining stocks, education, and industry insights. Originally published on February 20, 2025 by Cindy Feng of Bitcoinminingstock.io.
When preparing my annual Bitcoin mining report in December 2024, CleanSpark stood out with a number of key metrics, such as gross profits , hashrate growth, M&A activity, and hardware upgrades . I believed the company was poised for a successful year ahead — provided the price of Bitcoin continued to rise.
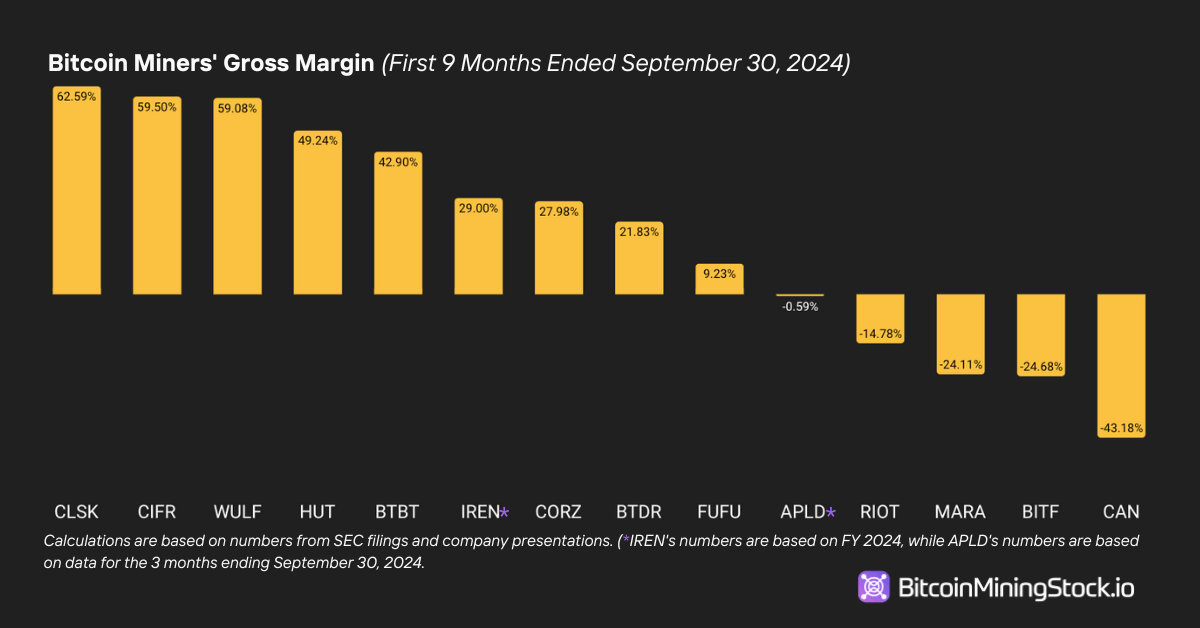 Screenshot from the annual report (co-authored with Niko Smid of Digital Mining Solutions)
However, after CleanSpark’s Q1 2025 financial report, released on February 6, 2025, the company’s stock price remained stable and even declined . This market reaction raised several questions for me: What numbers surprised investors? Did the company provide guidance that made investors uneasy? Let’s take a closer look at the numbers and analyze what might be going on.
Financial results: revenue and profitability increased significantly
CleanSpark had a successful first fiscal quarter of 2025 (October 1 – December 31, 2024) , delivering strong revenue growth and profitability as a result of the rising price of Bitcoin and improved operating efficiency.
Income Statement Key Figures:
- Revenue : $162.3 million (+120% year-over-year) compared to $73.8 million in Q1 2024. This was primarily driven by the rising price of Bitcoin , despite the decline in Bitcoin production as a result of the halving in April 2024.
- Net income : $246.8 million (+854% year-over-year) compared to $25.9 million in Q1 2024, primarily due to the revaluation of Bitcoin.
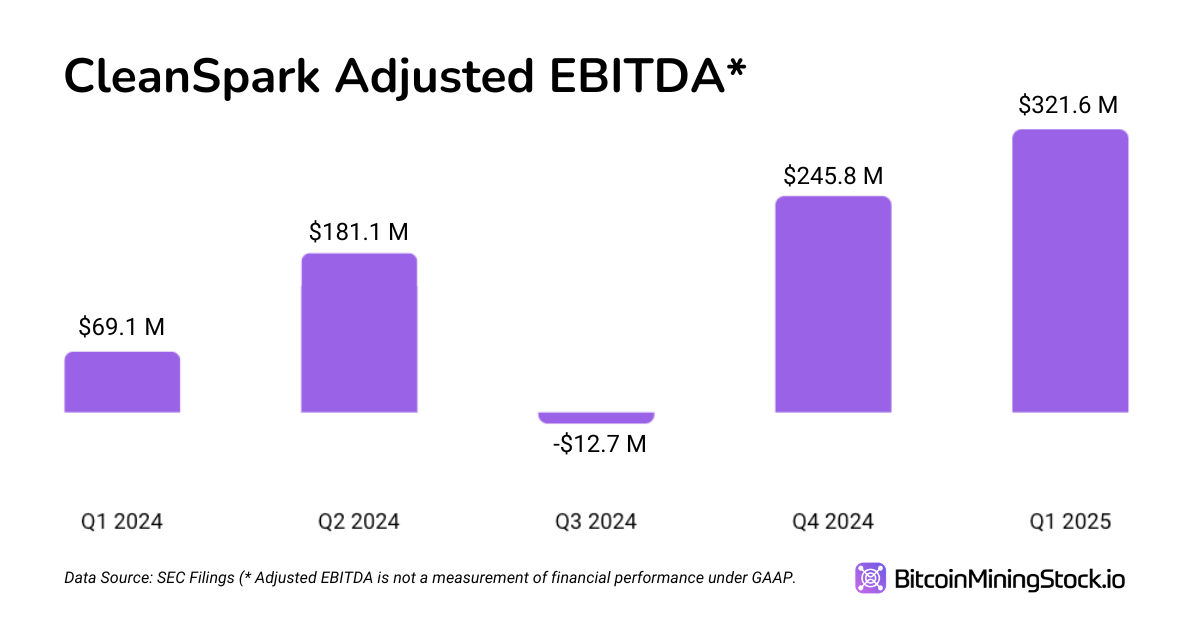
- Adjusted EBITDA : $321.6 million, a new record, up from $69.1 million. (*This figure includes a fair value gain of $218.2 million)
- Gross margin : 57%, slightly below 60% year-on-year due to higher operating costs (particularly electricity and infrastructure expansion in the mining sector)
- Bitcoin Mining : 1945 BTC, which is slightly less than 2020 BTC in Q1 2024 due to the Bitcoin halving in April 2024.
Key Balance Sheet Indicators
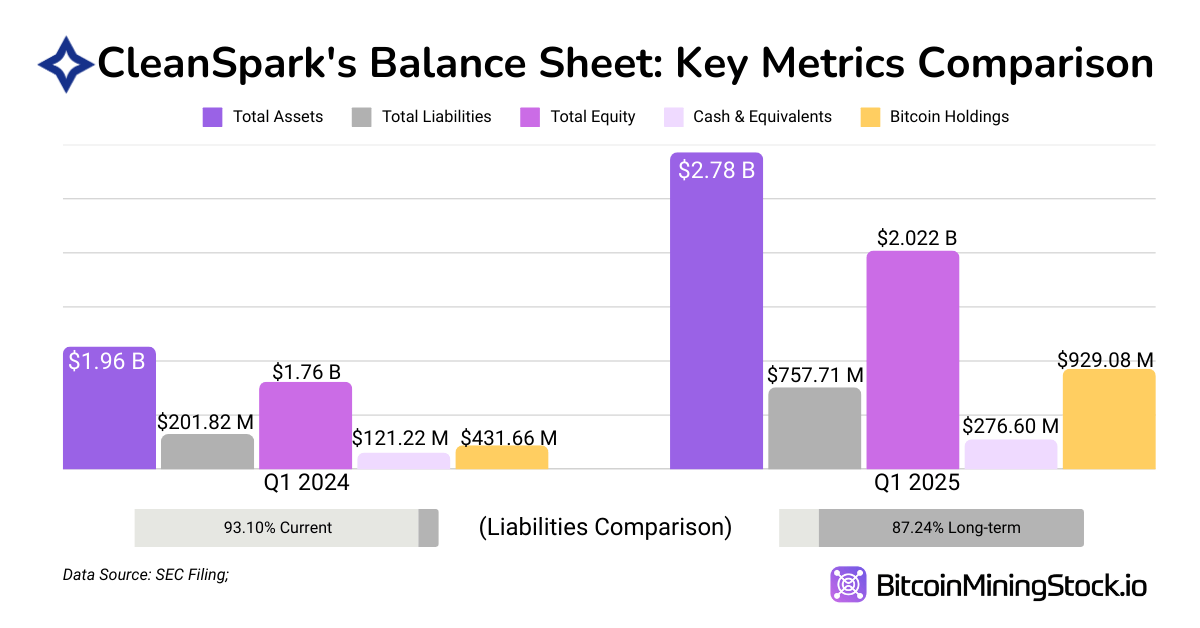
- Total assets : $2.78 billion (+41.6% YoY) vs. $1.96 billion in Q1 2024, driven by increased Bitcoin holdings, data center expansion, and new mining infrastructure.
- Total current liabilities: $96.7 million, down from $187.9 million, primarily due to debt repayments ($52.2 million paid).
- Long-term liabilities: $641.4 million (up from $7.2 million), primarily due to the issuance of new convertible notes.
- Equity : US$2.02 billion (+14.8% year-over-year) compared to US$1.76 billion in Q1 2024.
- D/E ratio: 0.32 (up from 0.08), indicating that CleanSpark has significantly increased its leverage over the past year, taking on more debt to fund growth.
Key Cash Flow Indicators
- Operating cash flow: $119.5 million in net cash used in operating activities.
- Investing cash flow: amounted to US$255.9 million (including US$126.9 million for new mining assets and US$57.4 million for property, plant and equipment).
-
Source: cryptonews.net