XRP Technical Analysis: Price Maintains Balance in Consolidation, Eyeing Critical Breakouts – Markets and Prices Bitcoin News

As of Dec. 12, 2024, the XRP/USD market reflects a steady consolidation phase across several timeframes, with bulls and bears locked in a tug-of-war at pivotal levels.
XRP
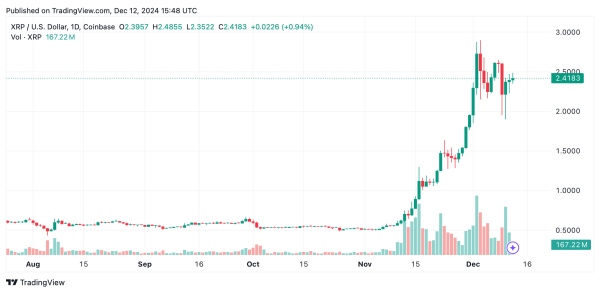
On Thursday, XRP’s daily chart paints a picture of an earlier uptrend tempered by recent consolidation. Prices climbed from $0.54 to a high near $2.91, encountering a ceiling at this level. A retreat to the $2.20–$2.40 support zone marks a period of stabilization. Should prices breach the $2.91 mark with significant trading volume, the bullish trajectory could resume. Conversely, a fall below $2.20 may hint at deeper corrections. While trading activity spiked during the rally, volumes have tapered off in the consolidation phase, mirroring traders’ indecision.

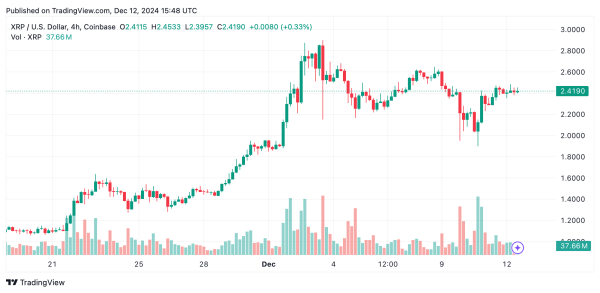
Zooming in on the 4-hour timeframe, XRP’s price oscillates between $2.20 and $2.65 after a sharp drop and subsequent recovery. The pattern of higher lows near $2.20 highlights support strength, while $2.65 continues to act as a formidable barrier. The muted trading volume during sideways action signals a lull in momentum, though heightened activity near $2.20 or $2.65 could offer some sort of direction.

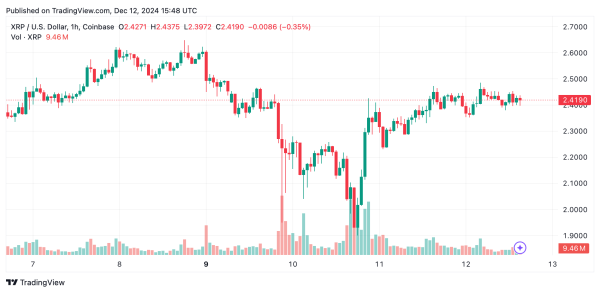
At the 1-hour level, XRP still exhibits tight consolidation like it did yesterday, bouncing between $2.38 and $2.48. These bounds serve as immediate support and resistance, respectively. Spikes in trading volume during tests of the $2.48 resistance underscore selling pressure. A definitive break above $2.48 could spark a short-term price surge while losing support at $2.38 might pave the way for a slide toward $2.28.

Key technical oscillators, such as the relative strength index (RSI), stochastic oscillator, and commodity channel index (CCI), hover in neutral territory, reflecting the ongoing consolidation. Meanwhile, momentum (10) and moving average convergence divergence (MACD) are flashing sell signals, with values of -0.30941 and 0.35614, respectively, suggesting a cautious approach to trading in this range.
All major moving averages—both simple and exponential—lean toward a positive stance. The exponential moving averages (EMA) for the 10, 20, and 50-day periods stand at $2.33602, $2.08261, and $1.51919, respectively, offering firm support. Their alignment above key price levels points to sustained upward potential for XRP in the medium term.
Bull Verdict:
If XRP can rally past the $2.91 resistance with substantial trading volume, it could reignite its upward trajectory, potentially revisiting recent highs or even exploring new ones. The alignment of key moving averages in buy territory and strong support levels reinforce the optimism for a medium-term bullish outlook.
Bear Verdict:
Should XRP break below the $2.20 support, it might signal a deeper corrective phase. With trading volumes declining and momentum indicators flashing caution, the risk of a downward move increases, potentially targeting lower support levels like $2.28 or below. Traders should exercise vigilance in this uncertain phase.


