XRP Price Report: Is the Next XRP Super Rally About to Begin? – Markets and Prices Bitcoin News

On Feb. 8, 2025, XRP traded at $2.41, boasting a $139 billion valuation, $7 billion in daily trade volume, and an intraday fluctuation between $2.35 and $2.53.
XRP
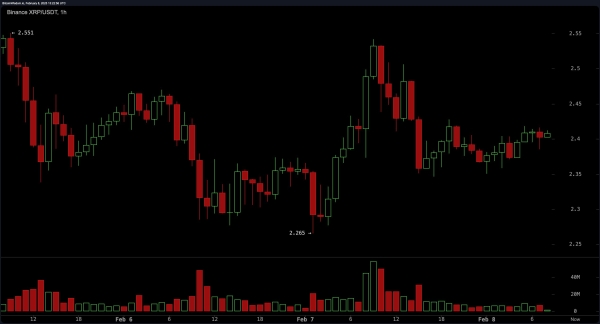
The hourly view reveals XRP oscillating between $2.30 and $2.40, crafting a series of ascending troughs that foreshadow a breakout. A hurdle at $2.45 looms, with stiffer opposition near $2.50. The $2.30 floor has repelled repeated sell-offs, demonstrating resilience. Trading activity has tapered slightly, implying calmer markets and a latent gathering phase. Piercing $2.42 may spark upward momentum toward $2.48 or $2.55, whereas slipping below $2.35 could invite downward momentum.

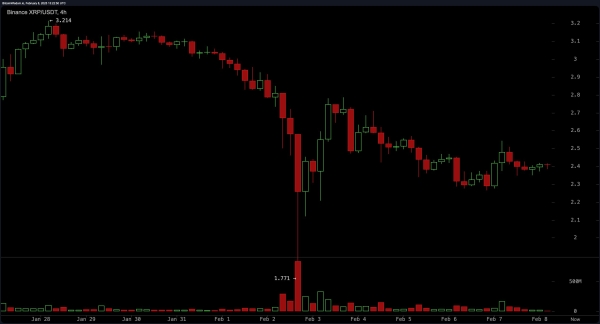
Zooming out, the four-hour lens illustrates a descent from $3.20 to $1.77, followed by a rebound. The $2.20 foundation stands unyielding, while $2.60 persists as a critical ceiling. Stability near $2.40, paired with muted volatility, signals equilibrium. Sustained buyer dominance above $2.40 might challenge $2.60 anew, though faltering here could revisit $2.20.

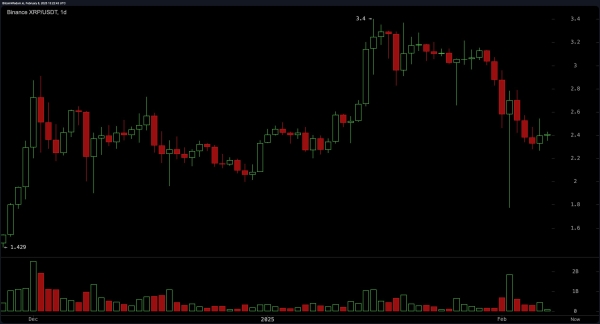
The broader daily scope captures a pronounced retreat from $3.40 to $2.40, amplified by intensified selling. Anchors between $2.20 and $2.40 brace against declines, while $3.00–$3.20 forms a formidable barrier. Despite recent bearishness, prolonged steadiness could seed a reversal. Transaction patterns hint at strategic accumulation at subdued prices, potentially propelling a rebound.

Momentum metrics diverge: the RSI at 37.57 reflects neutrality, while the Stochastic (42.09) offers no directional clarity. A CCI of -111.83 flashes a buy cue, countered by an ADX of 32.75 signaling modest trend vigor. The Awesome Oscillator (-0.33) echoes prudence, and the MACD (-0.09) alongside Momentum (-0.66) tilt bearish, mirroring lingering pessimism.
Short-term EMAs and SMAs (10–50 periods) paint a pessimistic tableau, while longer horizons inject optimism: the 100-period EMA (2.18) and SMA (2.09) suggest buying interest, as do the 200-period EMA (1.64) and SMA (1.33). Clinging above $2.40 may rejuvenate upward potential, but breaching key supports risks renewed declines.
Bull Verdict:
XRP’s price action suggests a potential breakout from consolidation, with strong support at $2.30 and growing signs of accumulation. If buyers sustain momentum above $2.40 and push past resistance at $2.50, the next target range lies between $2.60 and $2.80. Oscillators remain mixed, but long-term moving averages indicate underlying bullish strength, making a short-term rebound likely if key support levels hold.
Bear Verdict:
Despite a temporary stabilization, XRP remains in a corrective phase with bearish signals dominating short-term and medium-term moving averages. Selling pressure persists, with momentum indicators such as the moving average convergence divergence (MACD) and momentum indicator flashing sell signals. A break below $2.35 could accelerate losses toward $2.20 or lower, and without a decisive push above $2.50, downward risk remains significant.


