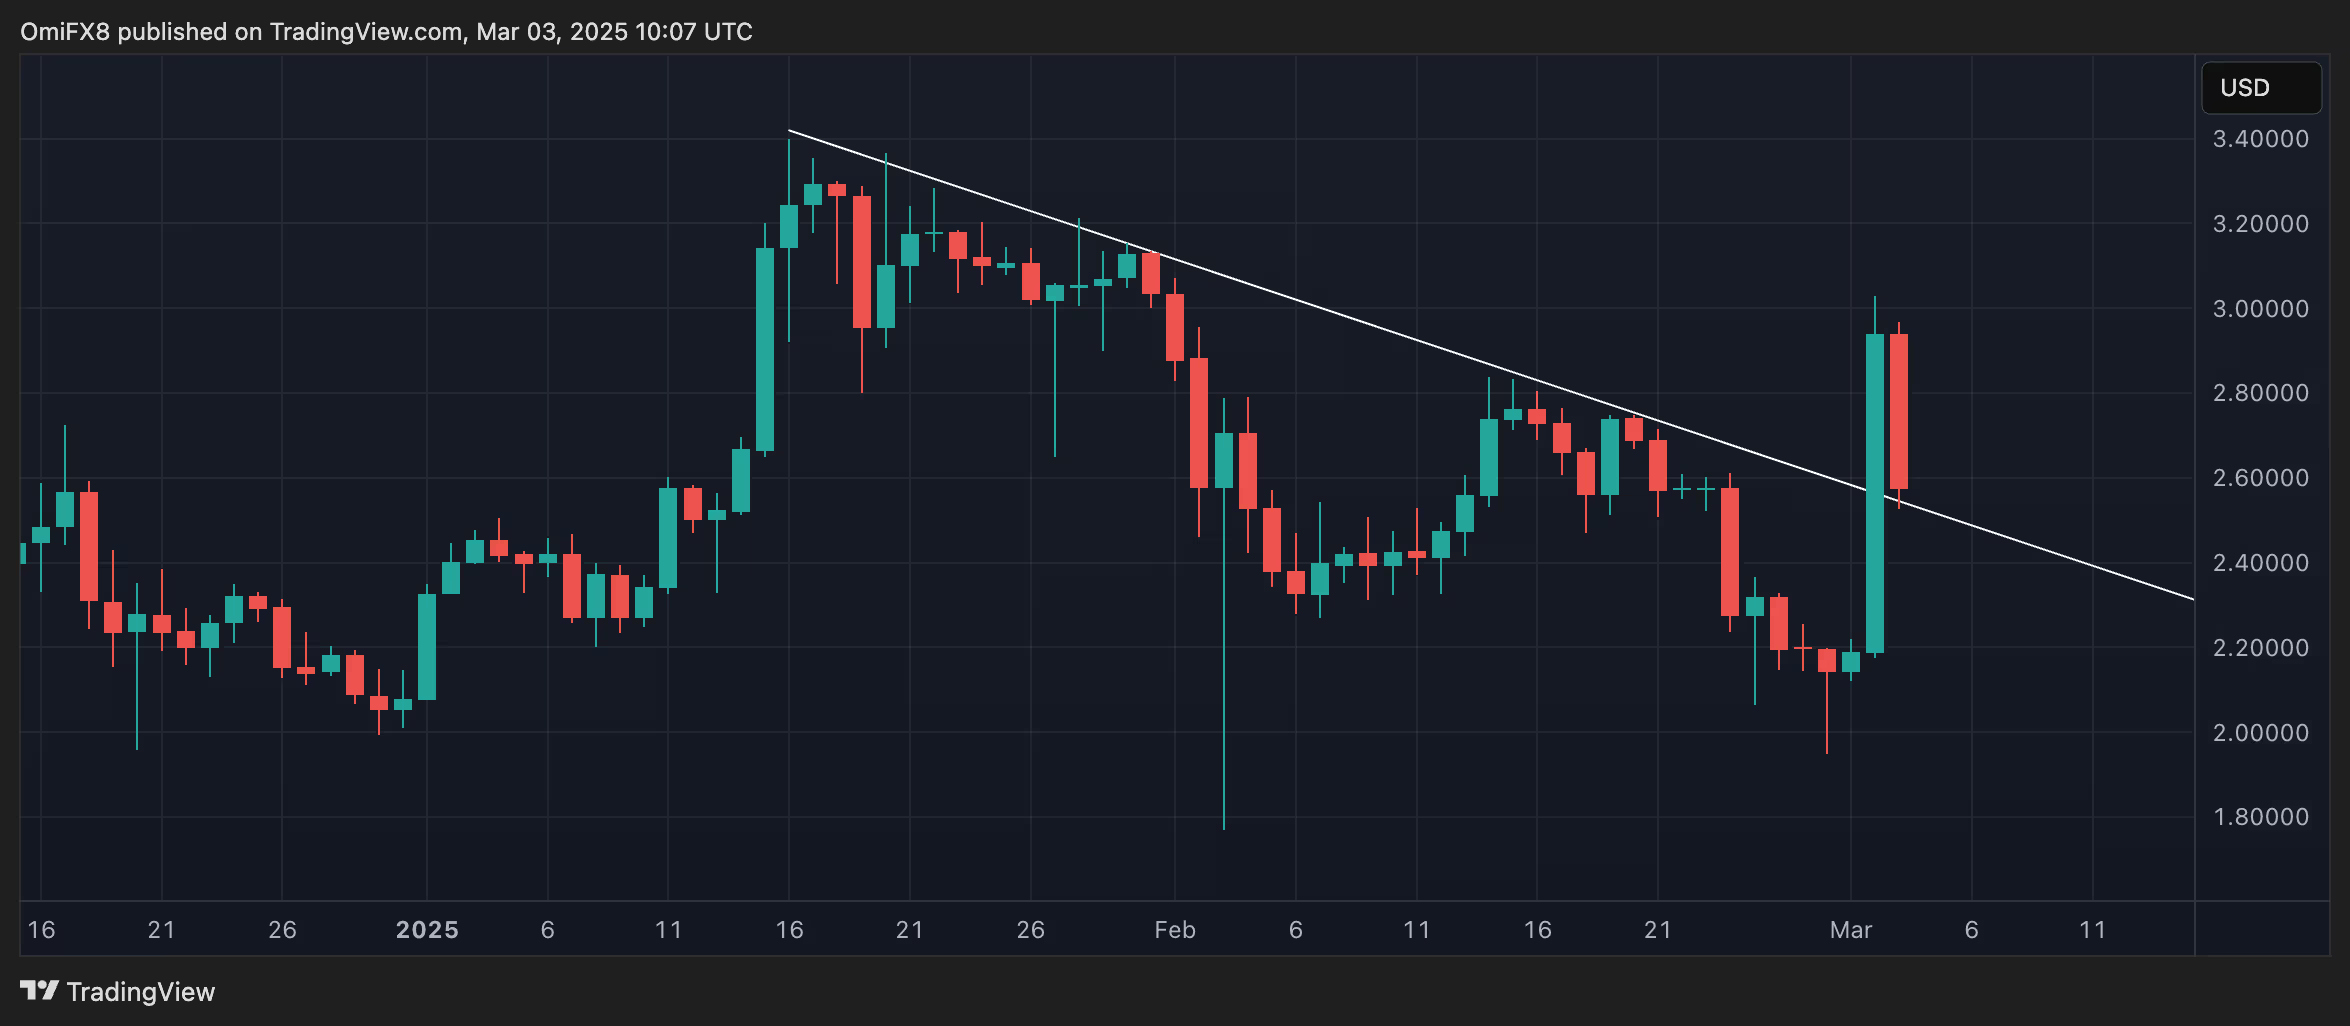
XRP Price Analysis: XRP Returns to Support After Rising to $3
Prices have returned to the downward trend line from the January 16 highs.
March 3, 2025, 11:20 UTC
What you need to consider:
- XRP surged 25% to $3 after Trump's strategic reserve announcement, but then fell back to $2.6, once again hitting the downward trendline from January highs.
- Technical indicators are showing a slowdown in the growth rate – RSI has dropped from the overheated 70 level to 48, MACD has turned bearish and dropped below zero, and prices are below the 50-hour simple moving average ($2.65) but above the 200-hour simple moving average ($2.50).
XRP took a pause a day after Donald Trump announced plans to create a strategic reserve of tokens including Bitcoin (BTC), Ethereum (ETH), Cardano (ADA), and Solana (SOL).
The payments-focused cryptocurrency jumped 25% in the hours following Trump’s Truth Social post, reaching $3, but has since retreated to $2.60 at the time of writing. Prices have returned to a downward trendline from their January 16 highs.
Among technical indicators, the relative strength index (RSI), which shows whether prices are moving too fast, reached 70 on Sunday evening and has fallen to 48 from above 70 or overheated levels seen on Sunday, suggesting a resumption of gains is possible.
However, prices remain below the 50-hour simple moving average ($2.65), indicating weakness, while the longer 200-hour simple moving average ($2.50) remains intact.
The hourly moving average convergence divergence chart shows a change in momentum, with its line crossing the signal at $3 (now below zero) confirming a bearish reversal after the rally.
Key levels
The 20-hour Bollinger Bands that define the price range point to $2.9 as the upper limit and $2.4 as the lower limit, with prices at $2.6 in the middle signaling a decline in volatility after the previous spike.
The rally to $3 has exhausted the buying pressure, while the RSI at 70 and the MACD crossover support the pullback. The break of the 50-hour SMA suggests short-term bearish control, but the 200-hour SMA at $2.5 represents important support.
The current price ($2.62) is at a critical point: a break below $2.50 could lead to further declines, while a move above $2.65 could target $3 and beyond. Short-term momentum favors the bears, and speculators can watch for volume and decisive moves for further positioning.