XRP Price Analysis: ‘Buy the Dip’ or ‘Sell the Rip’? Critical $2.50 Level Decides XRP’s Fate – Markets and Prices Bitcoin News

XRP’s price action on Feb. 18, 2025, reflects short-term bearish pressure amid critical support tests. Technical indicators signal cautious optimism for a rebound if key levels hold.
XRP
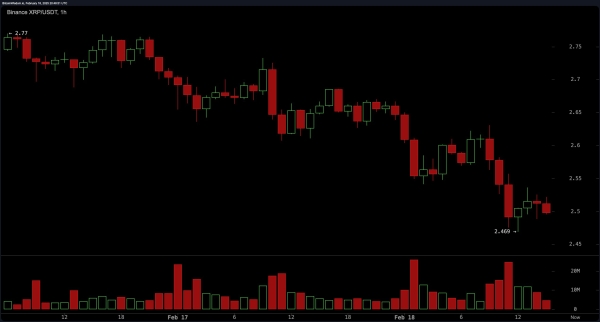
The 1-hour chart reveals a clear downtrend, marked by lower highs and lows, with XRP trading between $2.48 and $2.52 over the past hour. Immediate support lies at $2.45–$2.50, while resistance caps upward movement at $2.60–$2.65. Volume spikes on red candles underscore heightened selling activity, suggesting bearish momentum.

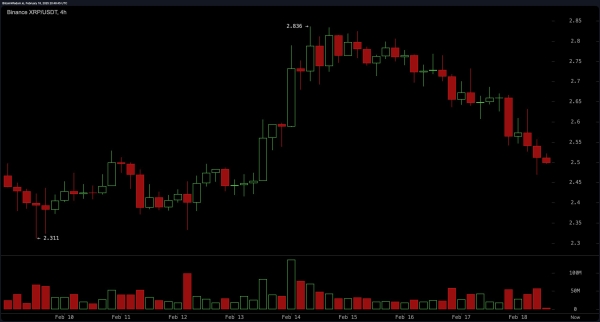
The 4-hour timeframe highlights a bearish reversal following a rejection at $2.80–$2.85, with XRP forming lower highs and lows toward $2.40–$2.45 support. Resistance at $2.65–$2.75 remains pivotal; a close above $2.60 could spark a retest of this zone. However, failure to hold $2.40 may accelerate declines to $2.20–$2.30. Traders should monitor these thresholds for confirmation of near-term direction.

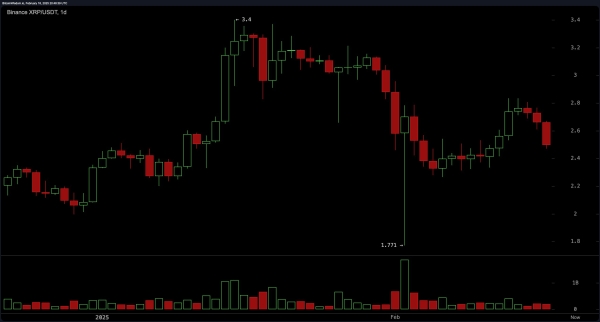
The daily chart shows XRP recovering from a plunge to $1.77, now consolidating above $2.40 after a failed rally near $2.80–$3.00 resistance. While the broader trend remains bullish, repeated rejections at lower highs suggest indecision. A sustained hold above $2.40 could reignite momentum toward $2.80+, but a breakdown here might invalidate recovery prospects, exposing the $2.20–$2.40 support band.

The readouts for XRP’s daily chart and key oscillators paint a neutral-to-mixed picture: the relative strength index (RSI) at 43.34 and Stochastic at 66.50 both signal neutrality. In contrast, the commodity channel index (CCI) at -19.56 and the average directional index (14) (ADX) at 30.83 reflect subdued momentum. Notably, the momentum indicator advises a sell at 0.079, contrasted by a buy signal from the moving average convergence divergence (MACD) at -0.040.
Shorter-term moving averages overwhelmingly suggest selling pressure: the exponential moving average (10) (EMA) at 2.60 and simple moving average (10) (SMA) at 2.57 both signal sell. Longer-term averages, however, lean bullish, with the exponential moving average (200) (EMA) at 1.73 and simple moving average (200) (SMA) at 1.43 flashing buy signals. This divergence underscores the tug-of-war between near-term bearishness and longer-term recovery potential.
Bull Verdict:
A bullish scenario hinges on XRP defending the $2.40–$2.45 support zone, which aligns with buy signals from the moving average convergence divergence (12, 26) (MACD) and long-term moving averages (EMA 200/SMA 200). A rebound above $2.60 could validate renewed bullish momentum, targeting the $2.80–$3.00 resistance band, supported by the daily chart’s recovery narrative and oversold conditions in shorter timeframes.
Bear Verdict:
A bearish outcome gains traction if XRP breaches $2.40, accelerating selling pressure as signaled by dominant sell calls from short-term moving averages (EMA 10/SMA 10) and the momentum (10) indicator. Lower highs on the 1-hour and 4-hour charts, coupled with volume-backed red candles, suggest a retest of $2.20–$2.30. Failure to reclaim the $2.65 resistance range would reinforce the downtrend, invalidating recovery hopes.


