XRP Price Analysis: Bulls on the Prowl as Resistance Shatters Limits – Markets and Prices Bitcoin News

XRP trades at $2.69 on Feb. 20, 2025, as bullish momentum contends with critical resistance levels amid mixed technical signals.
XRP
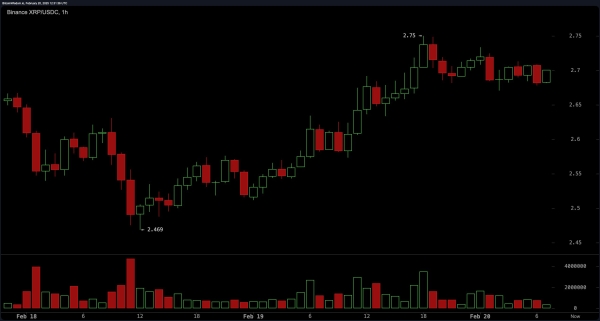
The 1-hour chart shows XRP stabilizing between $2.65 and $2.75, forming higher lows within a tentative ascending trend. Immediate resistance at $2.75–$2.80 remains pivotal; a breakout with volume could propel prices toward $2.85. Short-term support lies at $2.55–$2.60, with a break below risking a dip to $2.55.

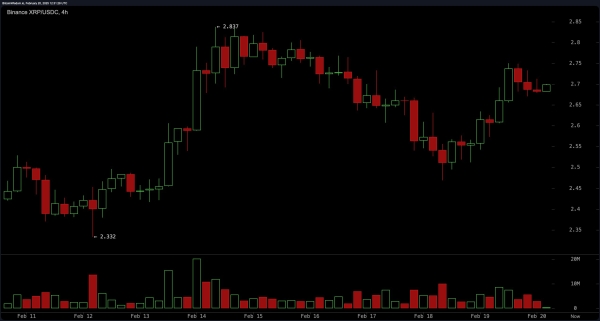
On the 4-hour timeframe, XRP fluctuates between $2.50 and $2.75, testing short-term support at $2.50. A rejection at $2.83 earlier underscores lingering selling pressure. Bulls currently eye a rebound from $2.50–$2.55, targeting $2.80–$2.85, while a breach of $2.50 could trigger a slide to $2.40. Traders should monitor volume closely: sustained buying above $2.50 may signal consolidation, whereas a breakdown demands defensive repositioning.

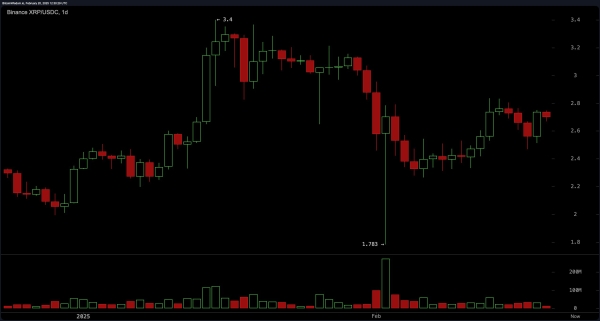
The daily chart reveals XRP recovering from a $1.78 low, now consolidating between $2.60 and $2.80. Higher lows suggest gradual bullish accumulation, but resistance at $3.00–$3.40 remains formidable. Key support at $2.20–$2.40 offers a potential buy zone, while breakout traders await a close above $3.00 with volume.

Oscillators present a mixed outlook: the relative strength index (RSI) at 51.84 and the commodity channel index (CCI) at 69.60 signal neutrality, while the moving average convergence divergence (MACD) hints at bullish divergence with a -0.01589 level. Momentum at 0.27585 leans bearish, contrasting the MACD’s optimistic signal. Overall, oscillators lack consensus, urging caution until clearer directional momentum emerges.
Short-term moving averages overwhelmingly favor bullish action: exponential moving averages (EMAs) (10, 20, 30, 50, 100, 200) and simple moving averages (SMAs) (10, 20, 100, 200) all signal bullishness. However, the SMA (30) at 2.74125 and SMA (50) at 2.72067 indicate bearish trends, reflecting resistance near $2.72–$2.74. Traders should weigh near-term EMA optimism against longer-term SMA caution, particularly around the $2.70–$2.75 supply zone.
Bull Verdict:
XRP’s price action showcases resilient bullish momentum, with higher lows on the daily chart and short-term moving averages overwhelmingly signaling bullish optimism. A breakout above the critical $2.75–$2.80 resistance, backed by strong volume, could ignite a push toward $2.85 and potentially $3.00, rewarding traders positioned for the upside. Despite mixed oscillators, the MACD’s bullish divergence and support at $2.50–$2.60 provide a solid foundation for optimism, favoring bulls in the near term.
Bear Verdict:
XRP faces persistent selling pressure at $2.75–$2.83, with resistance at $3.00–$3.40 proving a formidable ceiling. Mixed oscillator signals, coupled with bearish momentum and SMA (30, 50) bearish indications, highlight downside risks. A failure to hold $2.50 support could trigger a slide toward $2.40 or lower, leaving bulls vulnerable to renewed consolidation or a sharper pullback as overhead supply zones dominate.


