XRP Market Update: Price Holds at $2.60 as Bulls Eye Breakout to $3 – Markets and Prices Bitcoin News

XRP is buzzing at $2.62, boasting a market cap of $147 billion, a trading volume of $18.35 billion, and an intraday price range from $2.37 to $2.71.
XRP
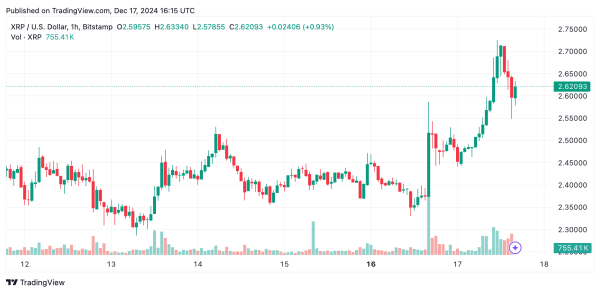
The 1-hour chart shows a thrilling spike to $2.72, followed by a dip with lots of trading action. Support is clinging around $2.55 to $2.60, while resistance is perched at $2.70 to $2.72. Notably, the volume jumps during the downturn hint at quick profit-taking and some selling pushback. Traders might want to grab buying chances near the $2.55 support if it sticks, aiming for the recent peaks.

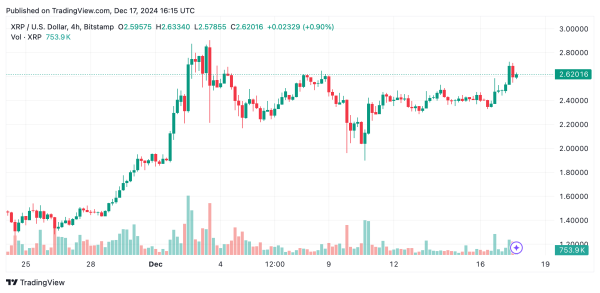
Zoom out to the 4-hour chart, and you’ll see a clear confirmation of the bullish leap to $2.72 before we felt a tug back. Support sits between $2.45 and $2.50, with resistance echoing at $2.70 to $2.72. Even with this retreat, the trend’s still pointing up, though the post-breakout sell-off suggests a chill period. If it stabilizes near $2.50, we could be in for more upward fun, but traders might start cashing out near those resistance levels.

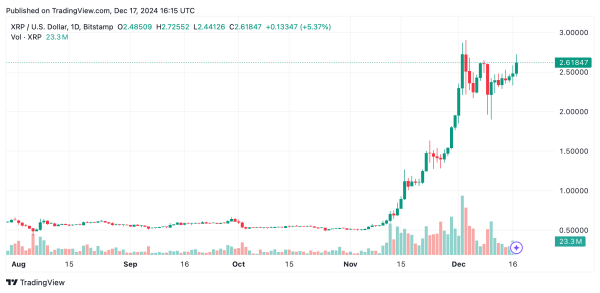
If you check out the daily chart, and you’ll see a story of steady upward drive, with XRP hitting a high of $2.91 before settling into a consolidation vibe. Support is lounging between $2.40 and $2.50, with resistance chilling at $2.90 to $2.91. Despite the pullbacks for profit-taking, the daily’s green candles from past weeks shout a long-term bullish narrative. A dip near $2.50 might be the perfect re-entry point for long-term traders, with a break above $2.91 possibly pushing for more gains.

Oscillators are giving us mixed vibes for XRP today, with the relative strength index (RSI), Stochastic, commodity channel index (CCI), and average directional index (ADX) all playing it cool in neutral territory. Momentum is whispering about selling pressure, while the moving average convergence divergence (MACD) is leaning bearish. On the flip side, the awesome oscillator is just shrugging, indicating no clear short-term momentum direction.
Dive into XRP’s moving averages (MAs), and you’ll find a bullish party still in action, with all exponential moving averages (EMAs) and simple moving averages (SMAs) from 10 to 200 periods waving the bullish flag. This consistent positive alignment across the moving averages supports a positive long-term trend, despite the short-term hiccups seen on smaller timeframes.
Bull Verdict:
XRP’s sustained support at $2.50 and the alignment of all moving averages in buy territory indicate strong bullish momentum. If buyers reclaim $2.70 and push past $2.91 resistance, a move toward the $3 mark or higher could materialize, reinforcing the long-term uptrend.
Bear Verdict:
While XRP shows strong historical gains, the recent pullback from $2.72 and neutral oscillator readings hint at waning short-term momentum. If support at $2.50 breaks, bears could drive prices lower, potentially retesting the $2.40 range or below, signaling a deeper correction.


