XRP, BTC News: XRP and Bitcoin Look Like a Coiled Spring Ready for a Big Move as Key Volatility Gauge Reflects 2024 Patterns
XRP Price Rises Significantly As Key Volatility Indicator Shows 2024 Patterns
Standard deviation-based indicator points to renewed surge in XRP and BTC volatility.
Author: Omkar Godbole Updated: April 20, 2025, 14:52 Published: April 20, 2025, 12:43

Key points:
- The price trends of XRP and Bitcoin resemble a tightly compressed spring, indicating the possibility of a significant move.
- Bollinger Bands for both cryptocurrencies hit their lowest levels since October 2024, indicating growing market energy.
- While tight ranges can lead to gains, they can also precede sell-offs, as happened in October 2022 after the FTX crash.
The price dynamics of XRP and Bitcoin (BTC) resemble a tightly compressed spring, ready to suddenly uncoil with a sudden release of energy.
This signals a key volatility indicator known as the Bollinger Bandwidth. Bollinger Bands are volatility indicators set at plus two and minus two standard deviations above and below the 20-period moving average (SMA) of the asset's market price. The band measures the distance between these bands as a percentage of the 20-day moving average.
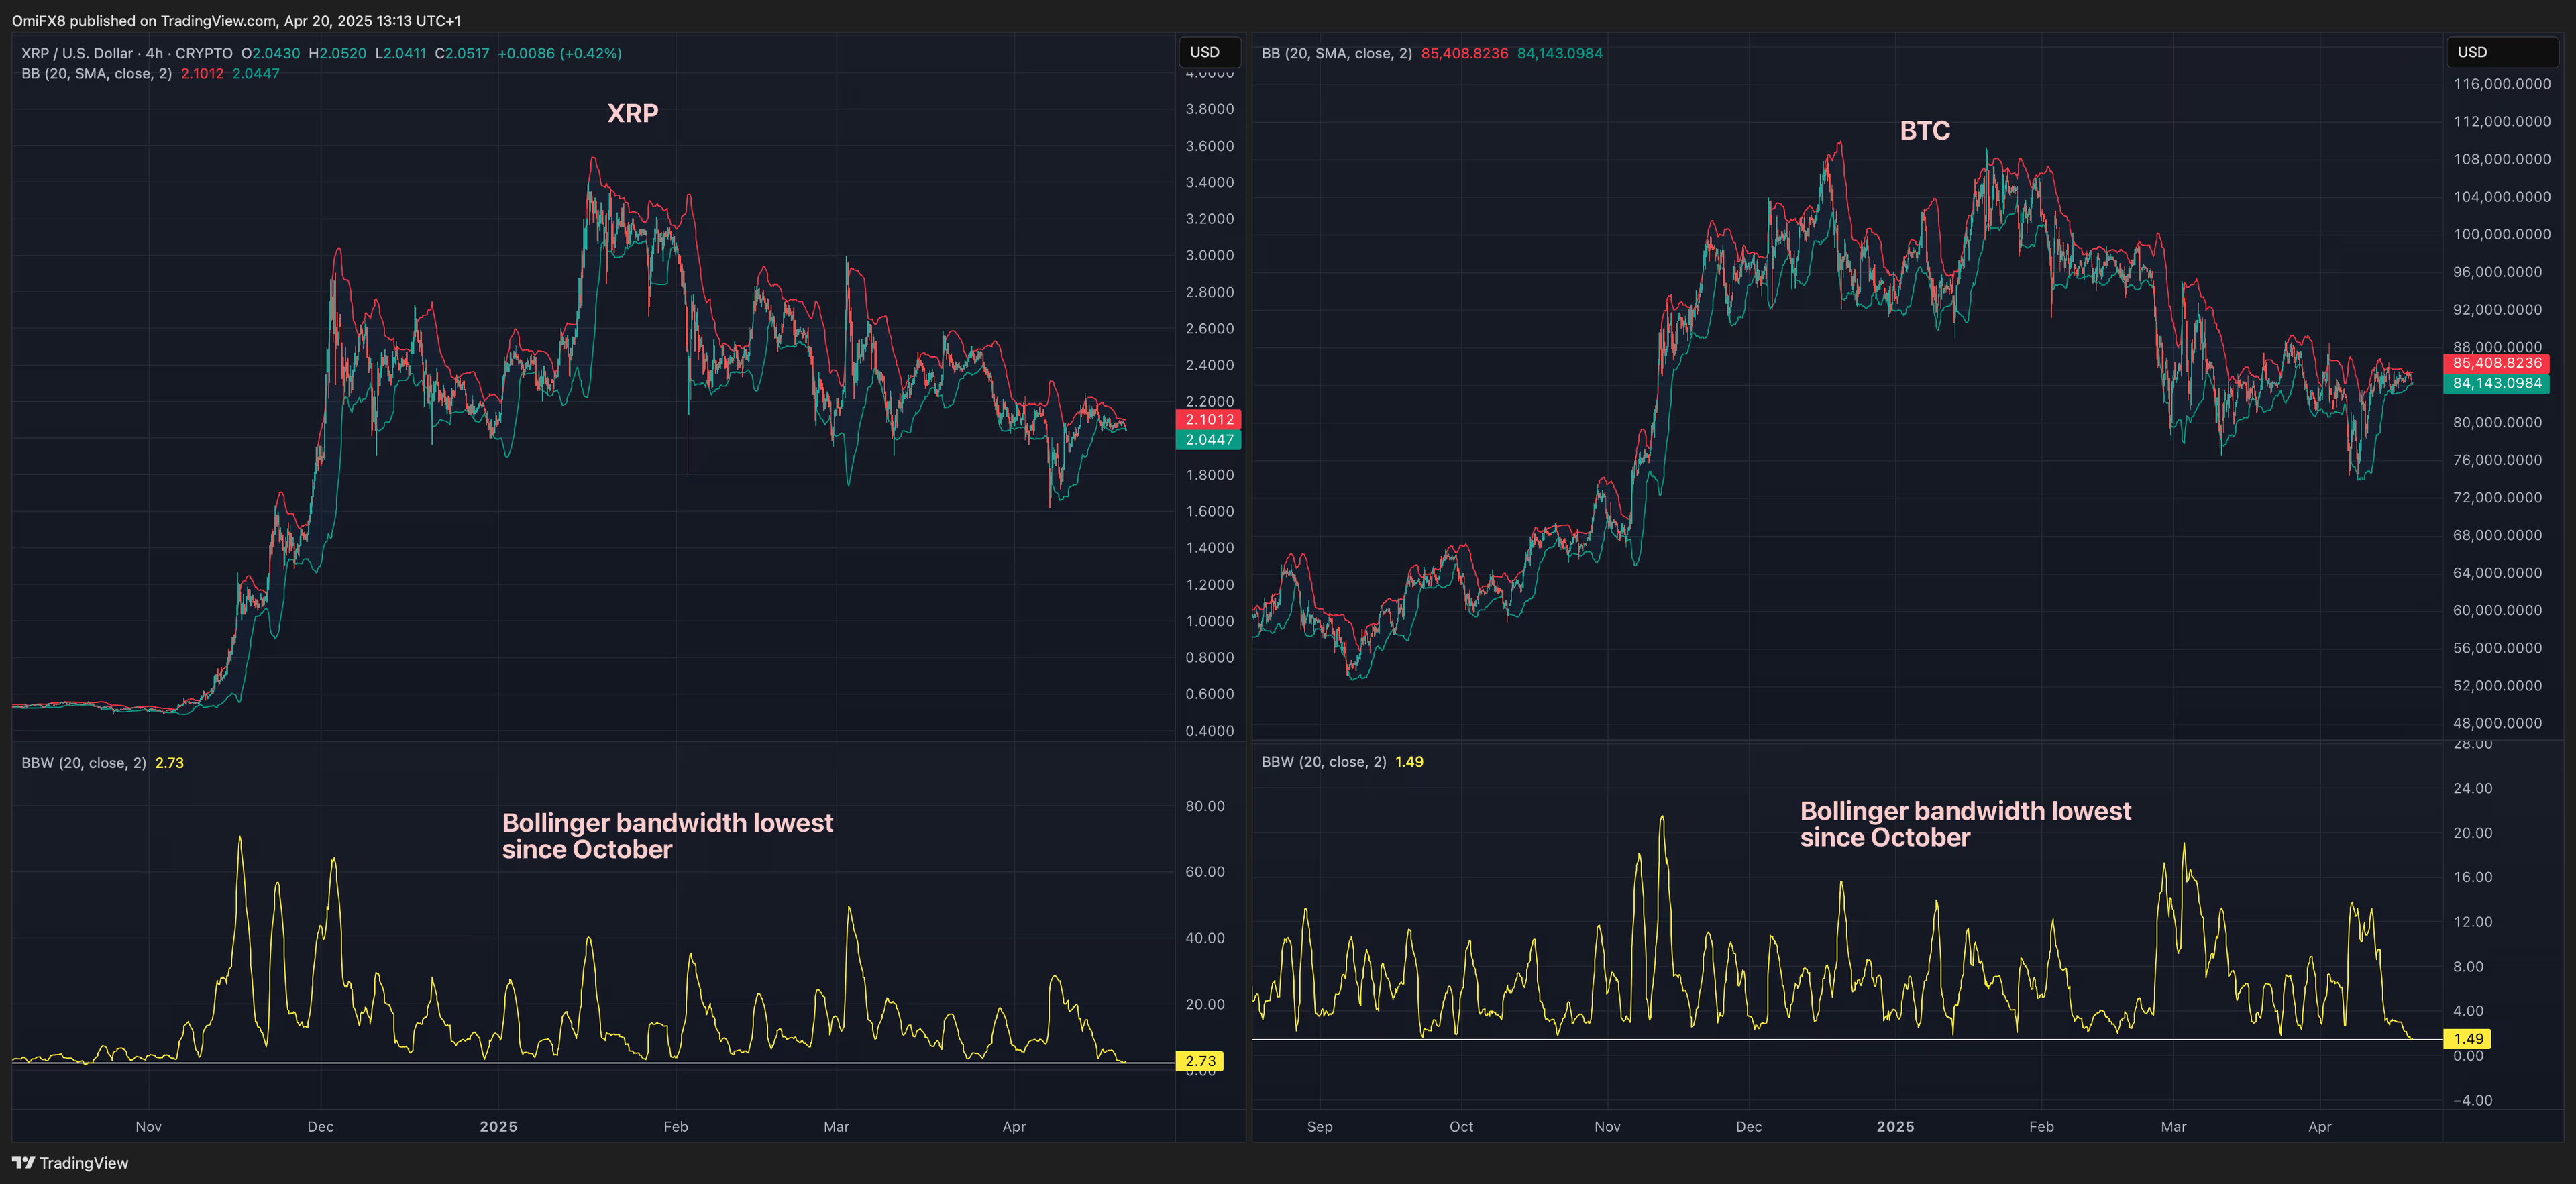
For XRP, the Bollinger Band width has narrowed to its lowest level since October 2024 on the 4-hour chart, where each candle reflects the price action over a four-hour period. The 4-hour chart timeframe is very popular in the 24-hour cryptocurrency market, allowing traders to analyze and predict short-term price movements. Bitcoin’s 4-hour chart shows a similar Bollinger Band width pattern to XRP.
It has long been believed that a narrower Bollinger Band, reflecting a period of calm in the market, is like a compressed spring ready for a significant move.
During these quiet phases, the market accumulates energy that is eventually released once a clear direction is established, often resulting in sharp rallies or sharp drops in price. Both XRP and Bitcoin saw significant gains in November and December after a long period of range-bound trading that left their bandwidth at levels comparable to what we see today.
However, narrower bands do not always predict a bullish surge in volatility; they can also foreshadow a sell-off. For example, the bands narrowed in October 2022, signaling a significant move forward that occurred in the downward direction after the FTX crash.
It remains to be seen whether this latest compression of the spring will lead to bullish volatility or a reversal.
Источник