S&P 500 Enters Correction Zone. What Does This Mean for BTC?
S&P 500 is in correction zone. How does this affect Bitcoin?
Historical analysis of S&P 500 and Bitcoin corrections.
James Van Straten | Edited by Oliver Knight Updated Mar 14, 2025, 1:39 pm UTC Published Mar 14, 2025, 11:18 am UTC
What to consider:
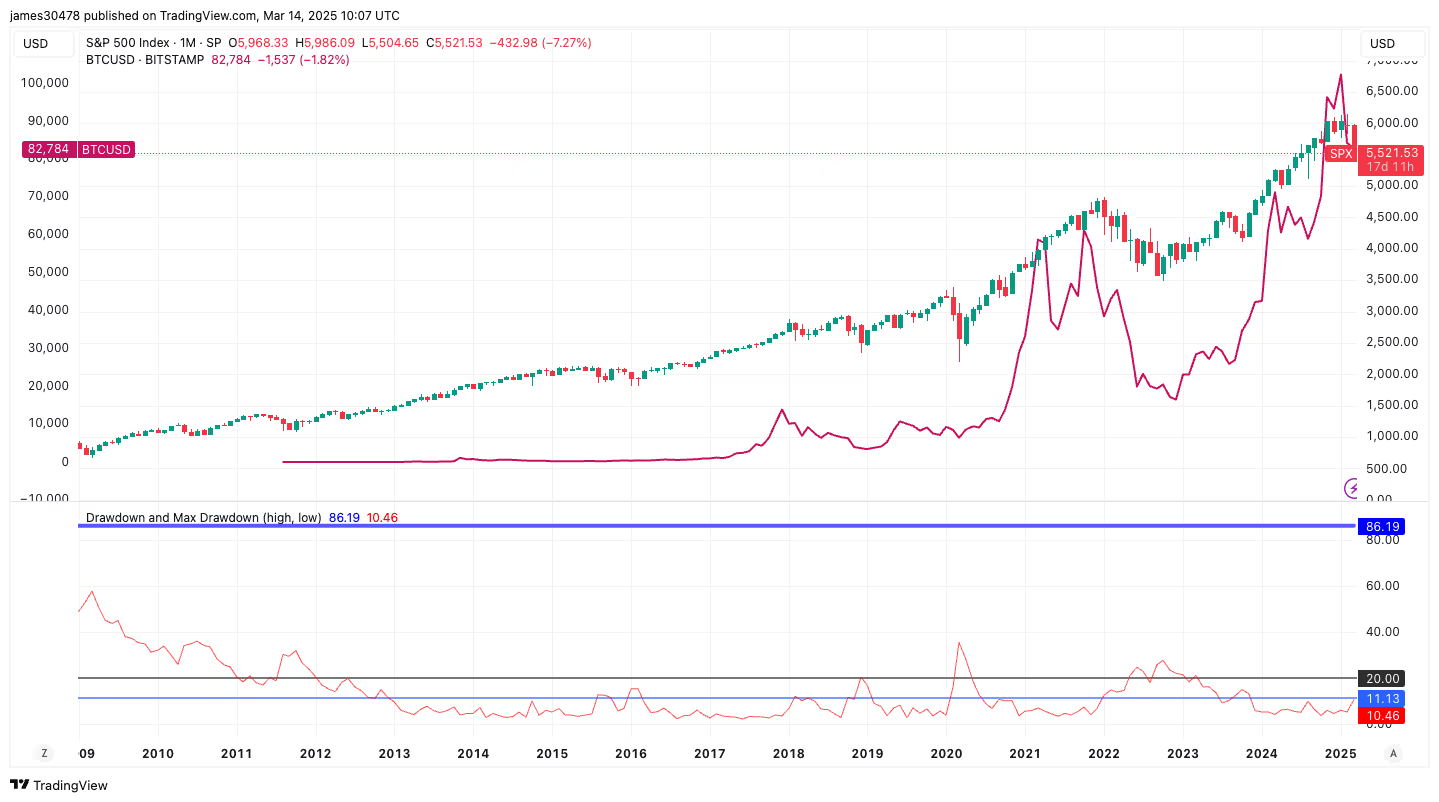
- The S&P 500 index has entered correction territory, down 10% from its all-time peak, while previously 20% corrections were recorded in 2009, 2019, 2020 and 2022.
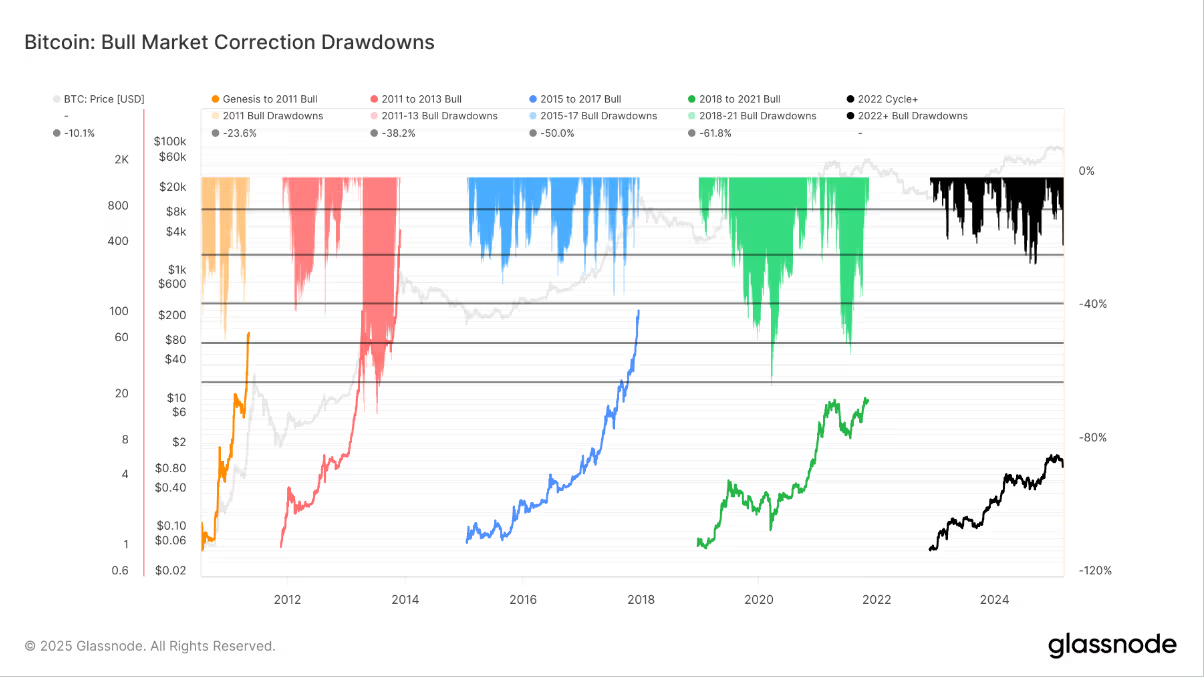
- Bitcoin has fallen 30% from its peak, a common pattern in previous bull market corrections, including the last one in August 2024 during the yen trading collapse.
The S&P 500 is currently in correction territory, which is defined as a 10% decline from its all-time high. Another 10% drop would signal the start of a bear market. But should we panic? The S&P 500 has experienced several 20% corrections since Bitcoin’s inception in 2009.
Following the 2008 global financial crisis, the index fell nearly 60%. In 2019, amid a Bitcoin bear market, the S&P 500 fell 20%, and Bitcoin lost 85% from its all-time high. The COVID-19 crash in March 2020 caused the index to fall nearly 40%, while Bitcoin lost 60% of its value. In 2022, the index corrected 25%, and Bitcoin bottomed out a month later, falling another 25% to a cycle low of $15,000.
In a historical context, 10% corrections in the S&P 500 are not uncommon. Meanwhile, Bitcoin has fallen 30% from its all-time high during this correction. Looking at previous bull market corrections, such declines are considered normal, especially the last 30% correction that occurred in August 2024 during the Yen carry trade reversal.