Bitcoin Price Analysis: Short-Term Bulls Eye $98,800 Breakout for Rally Toward $100,000 – Markets and Prices Bitcoin News

Bitcoin edges higher to $97,973 to $98,323 over the last hour, as traders assess macroeconomic and inflation signals alongside key technical levels.
BTC
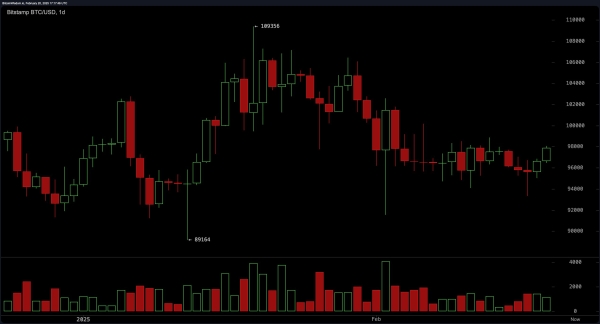
Bitcoin’s daily chart shows price action stabilizing between $96,000 and $98,000, following a 10.3% retreat from its January 20, 2025, all-time high. The macro trend remains in a pullback phase, with critical resistance at $109,356 and support at $89,164. A hold above $96,000 could signal a bullish reversal toward $102,000–$105,000, while a drop below $94,000 may trigger a retest of $90,000. Traders are closely watching this range to gauge directional momentum.

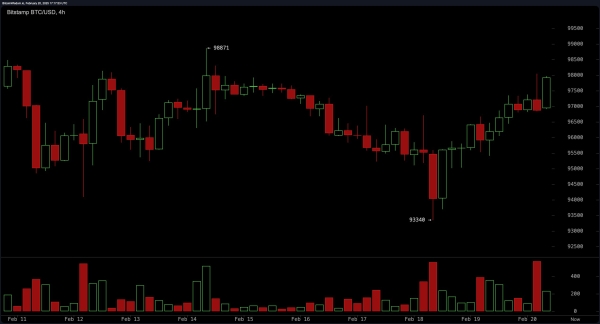
The 4-hour chart reveals a rebound from the $93,340 support level, with buying volume spikes suggesting renewed bullish interest. Bitcoin now faces immediate resistance at $98,871. A breakout above this level could accelerate gains toward $100,000, while rejection here might prompt a pullback to $94,000–$95,000. This timeframe underscores the importance of $98,800 as a pivotal threshold for confirming short-term bullish continuation or renewed bearish pressure.

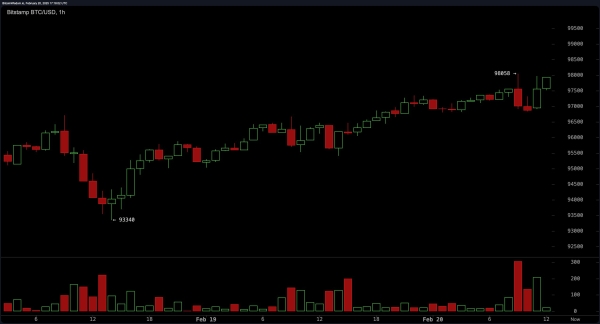
Intraday traders are eyeing the 1-hour chart, where bitcoin maintains a steady uptrend after retesting $93,340. Resistance at $98,058 is key; a breach could spark a rapid climb toward $99,500. Scalpers may consider long entries above $97,800 with targets at $99,000–$100,000. Conversely, failure to hold $98,000 might invite short-term bears to target $96,500. Rising volume supports bullish momentum, but volatility remains a risk.

Oscillators present a neutral-to-buy bias: the relative strength index (RSI) at 49 and momentum at 281 signal cautious optimism, while the moving average convergence divergence (MACD) at -872 leans bullish.
Moving averages (MAs) show conflicting signals: exponential moving averages (EMA 10, 20) at $96,904 and $97,595 suggest buys, while EMAs above $98,029 (EMA 30, 50) indicate sell pressure. Long-term EMAs (100, 200) remain split, highlighting market indecision. At press time, at 1:20 p.m. ET on Thursday, BTC is exchanging hands for $98,263 per unit.
Bull Verdict:
Bitcoin’s ability to hold above $96,000, coupled with bullish signals from the momentum at 281 and moving average convergence divergence (MACD) at -872, supports a recovery scenario. A breakout above $98,800 on the 4-hour chart could ignite a rally toward $102,000–$105,000, with short-term scalping opportunities above $97,800 reinforcing upside potential.
Bear Verdict:
Failure to sustain $96,000 risks a breakdown toward $94,000, where bearish momentum could accelerate. Sell signals from longer-term exponential moving averages (EMA 30, 50) above $98,029 and neutral oscillators like the relative strength index (RSI) at 49 suggest vulnerability. A close below $94,000 may confirm a bearish trend reversal, targeting $90,000 amid macroeconomic uncertainty and Fed-driven risk aversion.


