Bitcoin Price Analysis: Is a Breakout to $105K on the Horizon or a Collapse Below $90K Looming? – Markets and Prices Bitcoin News

Bitcoin traded at $97,705 with a market cap of $1.93 trillion and a lower than usual 24-hour trade volume of $15.54 billion, experiencing a quiet session on Saturday, Feb. 15, 2025, within an intraday price range of $97,089 to $97,965.
Bitcoin
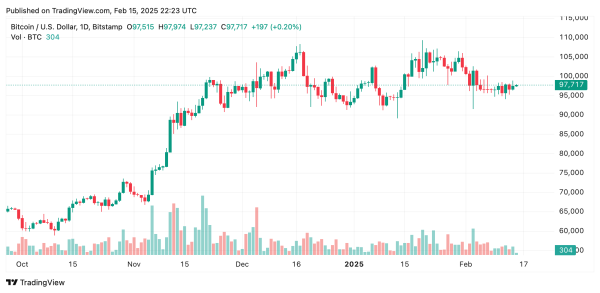
Bitcoin’s daily chart analysis reveals that BTC has been consolidating after a sharp correction, with key support at $89,164 and resistance at the $109,356 peak on Bitstamp. A break above the $100,000 level could indicate a bullish continuation, while rejection could lead to further downside. Fibonacci retracement levels based on the recent swing high of $109,356 and swing low of $89,164 highlight critical points, with the 23.6% retracement at $93,929, 38.2% at $96,877, 50.0% at $99,260, 61.8% at $101,643, and 78.6% at $105,035. A decisive move beyond $101,643 could propel BTC toward higher resistance zones, while failure to hold above $99,260 may trigger a decline toward $96,877 or lower.

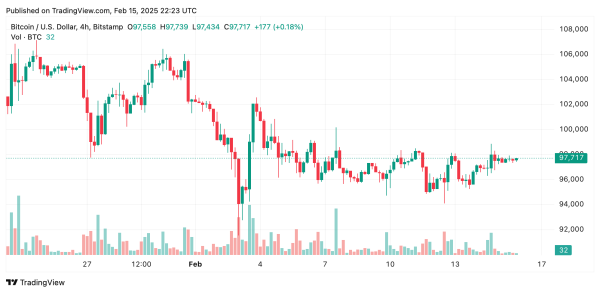
BTC’s four-hour chart shows a slowing downtrend on Saturday, with support at $94,091 and resistance at $102,569. A higher low has formed, signaling a possible bullish reversal if bitcoin can maintain momentum above $99,000. Conversely, a rejection near the $100,000 mark could result in renewed selling pressure. Bitcoin’s four-hour Fibonacci retracement levels from the recent swing high to swing low indicate that the 50.0% retracement at $98,330 and 61.8% at $99,751 are critical resistance points. If BTC breaks above these, a move toward $102,000 could be likely, whereas a failure to sustain buying pressure may lead to a retest of $94,091.

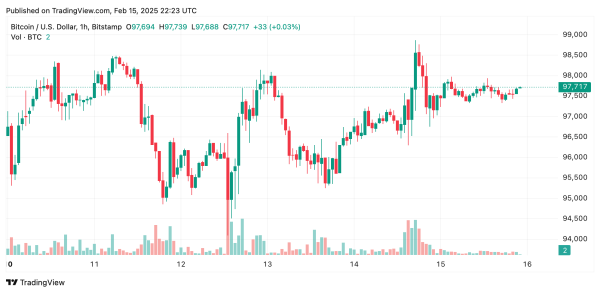
The leading crypto asset’s one-hour chart currently reflects a short-term bounce from $95,249, with resistance at $98,871. Volume has been declining, suggesting price stagnation, and a break above $99,000 with strong buying interest could lead to a move higher. However, lower highs forming below $98,500 may indicate weakening momentum. Presently, the one-hour chart’s Fibonacci retracement levels highlight the 50.0% retracement at $97,060 and 61.8% at $97,750 as key areas to watch, with a break above potentially signaling bullish continuation, while failure could result in a drop back to support near $95,249.

Oscillator readings are mixed this weekend, with the relative strength index (RSI) at 47, Stochastic standing at 48, the commodity channel index (CCI) at -37, and the awesome oscillator at -3,164, all in neutral territory. However, momentum at 1,081 indicates an optimistic signal, while the moving average convergence divergence (MACD) level at -892 suggests some bearish pressure.
Moving averages are also divided on Saturday, with the exponential moving average (EMA) 10 at BTC price of $97,516 and the simple moving average (SMA) 10 at $96,900 signaling bullish conditions, while the EMA 20, SMA 20, EMA 30, and SMA 30 indicated negative signals. The longer-term EMAs and SMAs for 100 and 200 periods remained bullish, reflecting underlying strength in bitcoin’s price structure at the moment.
Overall, bitcoin’s price action remains at a critical juncture, with key resistance levels near $100,000 determining its next directional move. A breakout above this psychological barrier with strong volume could push prices toward $102,569 and beyond, while failure to sustain momentum may trigger a retest of lower support levels near $94,091.
Bull Verdict:
Bitcoin’s price structure remains intact despite recent consolidation, with strong long-term support from the 100-period and 200-period moving averages. A break above $100,000 with sustained volume could ignite bullish momentum toward $102,569 and potentially $105,035, aligning with key Fibonacci retracement levels. If buyers reclaim control, bitcoin may enter a renewed uptrend, targeting fresh highs in the coming weeks.
Bear Verdict:
With multiple rejections near key resistance levels and declining volume, bitcoin faces the risk of further downside pressure. The MACD remains in bearish territory, and failure to break above $100,000 could lead to a retest of support near $94,091, or even a drop toward $89,164 if selling pressure intensifies. If bitcoin struggles to hold above the 50.0% Fibonacci retracement level, a deeper correction may unfold.


