Bitcoin and Nasdaq News: BTC's 200-Day Moving Average Support Under Threat as Nasdaq Forms 'Double Top'
The technical outlook has worsened for both BTC and Nasdaq.
March 4, 2025 8:13 UTC

What you need to know:
- On Monday, the Nasdaq triggered a double top breakout, adding to the short-term bearish sentiment in BTC.
- In December, the bullish momentum of both assets dried up simultaneously.
Research service Ecoinometrics reported on Monday that Bitcoin's (BTC) long-term recovery is closely tied to the Nasdaq's gains, highlighting a significant positive correlation between the two.
Unfortunately for crypto bulls, the Nasdaq initiated a significant bearish reversal pattern known as a “double top” on Monday, threatening support for BTC’s 200-day simple moving average (SMA).
Bitcoin, the leading cryptocurrency by market cap, has fallen more than 10% in the past 24 hours, reversing Sunday's price rally to $95,000. At one point this morning, prices tested support from the 200-day SMA at $82,587, according to data from charting platform TradingView.
The 200-day simple moving average is generally considered an important indicator of long-term trends, and price drops below this level are often interpreted as a signal of potential significant losses in the future.
There is a possibility that BTC price will fall below its long-term average as Wall Street's tech-heavy Nasdaq index fell 2.2% on Monday, triggering a double-top breakout.
A double top consists of two peaks separated by a trough and forms over a period of approximately two to six weeks. The gap between the two peaks must be equal to or less than 5%, and the distance between the peaks and the trough must be at least 10%, according to technical analysis theory.
These are guidelines, not hard and fast rules; context matters, meaning for the pattern to be valid it must occur after a long uptrend, as in the case of the Nasdaq.
The Nasdaq has formed two peaks near $22,200 since mid-December, with a low of $20,538. The index ended Tuesday below the low's support, confirming a bearish double-top reversal pattern.
According to technical analysis theory, the subsequent decline could be at least 70% of the distance between the peaks and the troughs, which suggests the Nasdaq could fall to 19,400. According to CMT analysis, the historical failure rate of this pattern is 11%. This means that failures more often result in deeper losses than no losses.
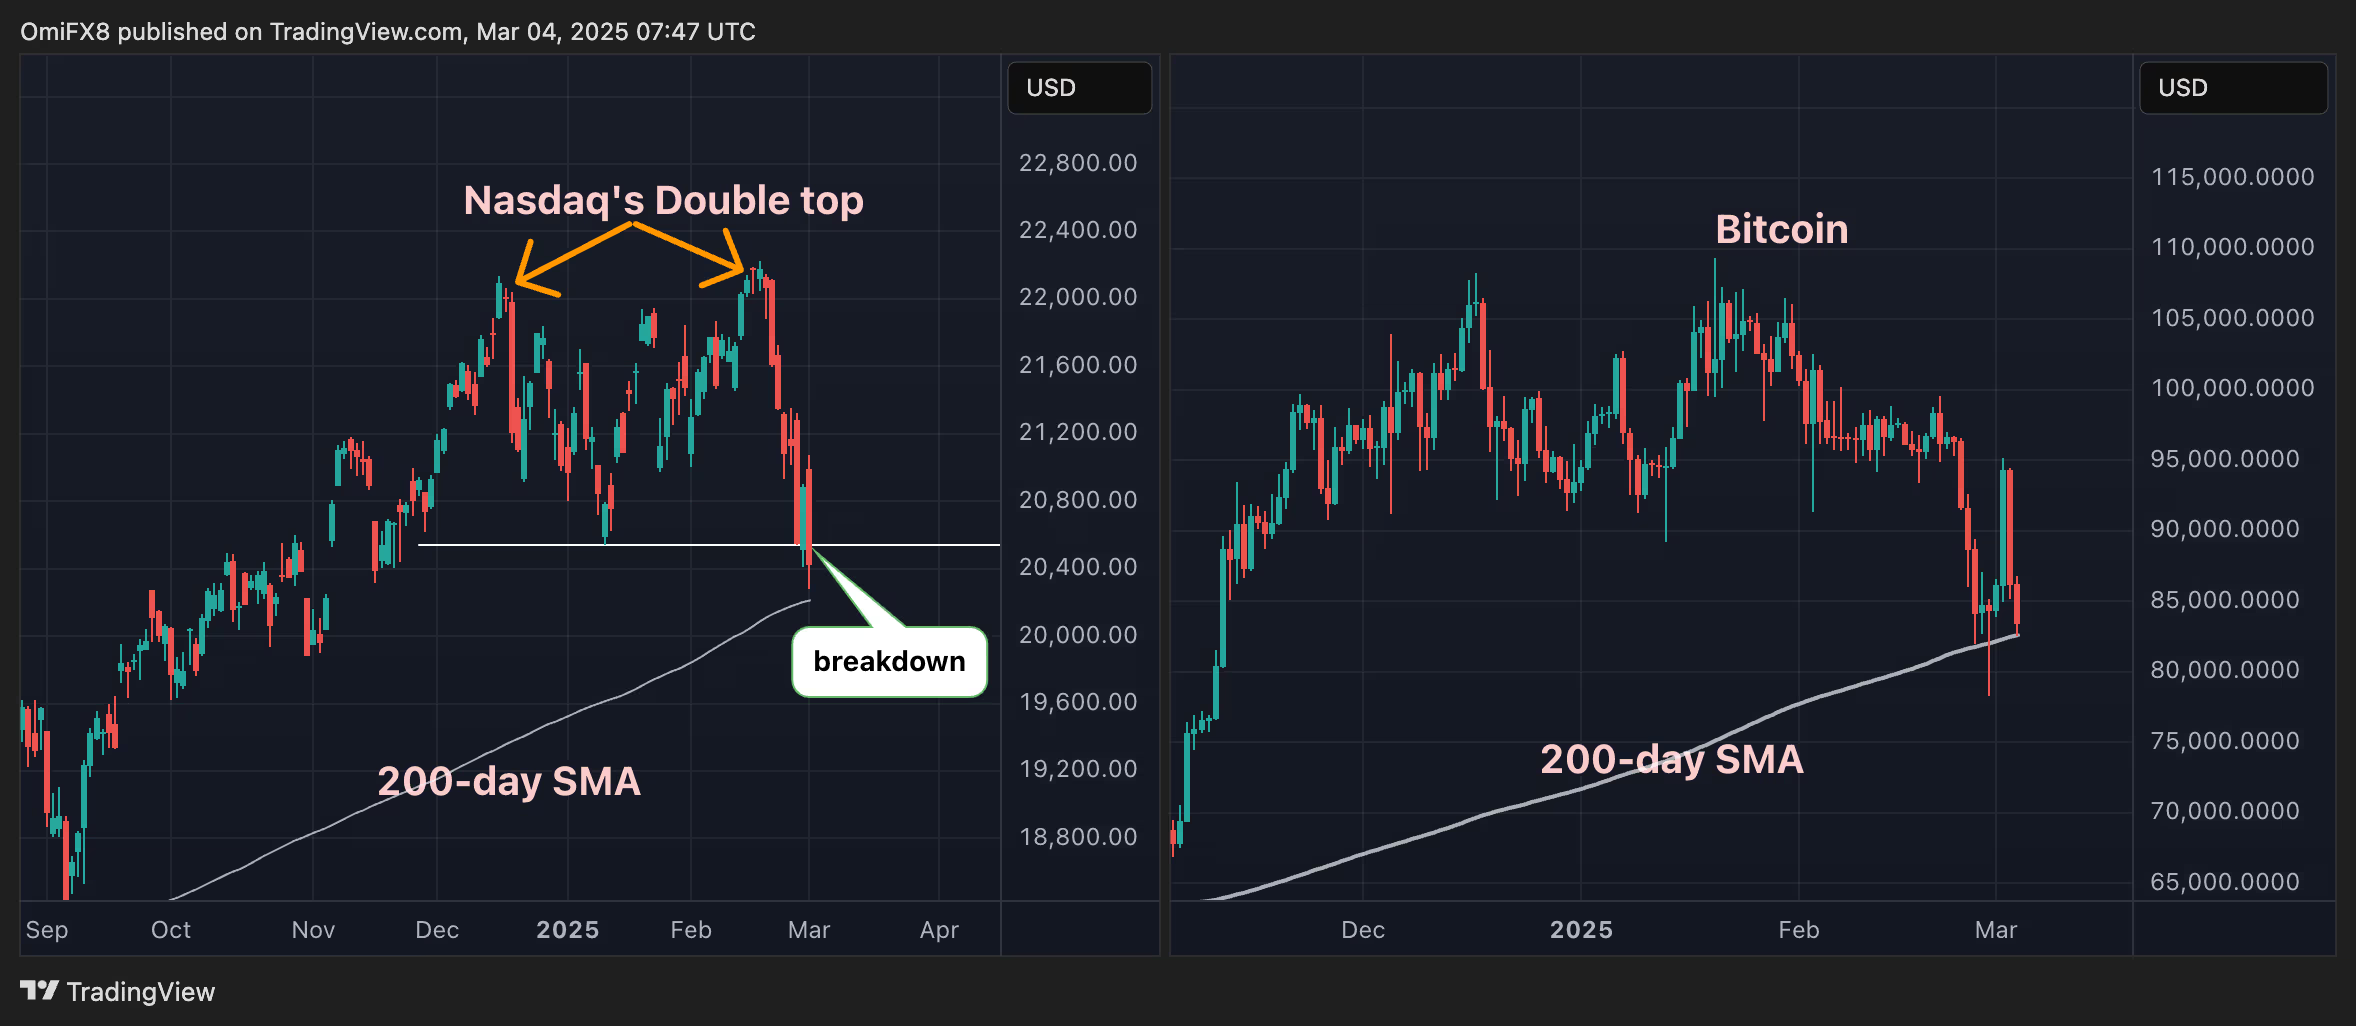
Both the Nasdaq and BTC lost their bullish momentum in December and have since peaked, trading near their 200-day moving averages.
Below the 200-day simple moving average, the next support for Bitcoin is located directly at the former all-time high (resistance) turned support at $73,757.