Cryptocurrency Technical Analysis
The cryptocurrency market has a lot of nuances and features that even experienced traders sometimes do not know about. Due to the constant release of new software products and various tools, even qualified specialists constantly have to update their knowledge and get acquainted with new technologies. In this article, we will analyze the basics of technical analysis of cryptocurrencies, trend recognition and other nuances of the industry.
What is a technical analysis in cryptocurrency trading?
There are several types of technical analysis of cryptocurrencies, but the most common of them is the Dow theory. It has many rules, the most basic of which are the following points:
- The market does not miss anything. The cost of cryptocurrencies may depend on future demand, on the current situation and past trends. Also, coins are sensitive to any changes in regulation.
- Price dynamics are not chaotic. Many inexperienced traders believe that the value of cryptocurrencies changes in a chaotic manner, but in reality this is not so. There are a number of figures that chart the price of digital assets.
- History repeats itself. The market can often be predicted by the cyclical effect. Traders are not always able to respond to important historical events, which is why they simply miss important trends.
Next, we will consider the process of conducting a technical analysis of the cryptocurrency market in more detail.

Trend recognition
A trend is an asset’s direction. If the value of the coin begins to drop, then we are talking about a downtrend. With the growth of a coin, it is customary to call the process an upward trend. As an example, you can take bitcoin, which has always been characterized by surges in volatility. Competent tech analysts rarely pay special attention to the jumps in instability, because they know that trends are changing sooner or later, so it’s enough just to wait for the right moment to conduct a transaction. The presence of a clear plan of action and analytics will make it possible to quickly build a figure on the graph of the price tag of a particular cryptocurrency and determine the vector of its further movement. There are three types of trends:
- Downward. It represents an asset drawdown and chart movement to lows. To determine the downward position, you need to fix the highest point of the line and draw a strip to the minimum cost. When the price tag starts to rise again, the phenomenon is called breaking through a downtrend.
- Ascendant. Such a trend is determined by the minimum position of the line from which the line is drawn to a possible maximum.
- Side. The phenomenon is characteristic of a decrease in cryptocurrency volatility. With a sideways trend, the value of the coin remains stable for a certain time.
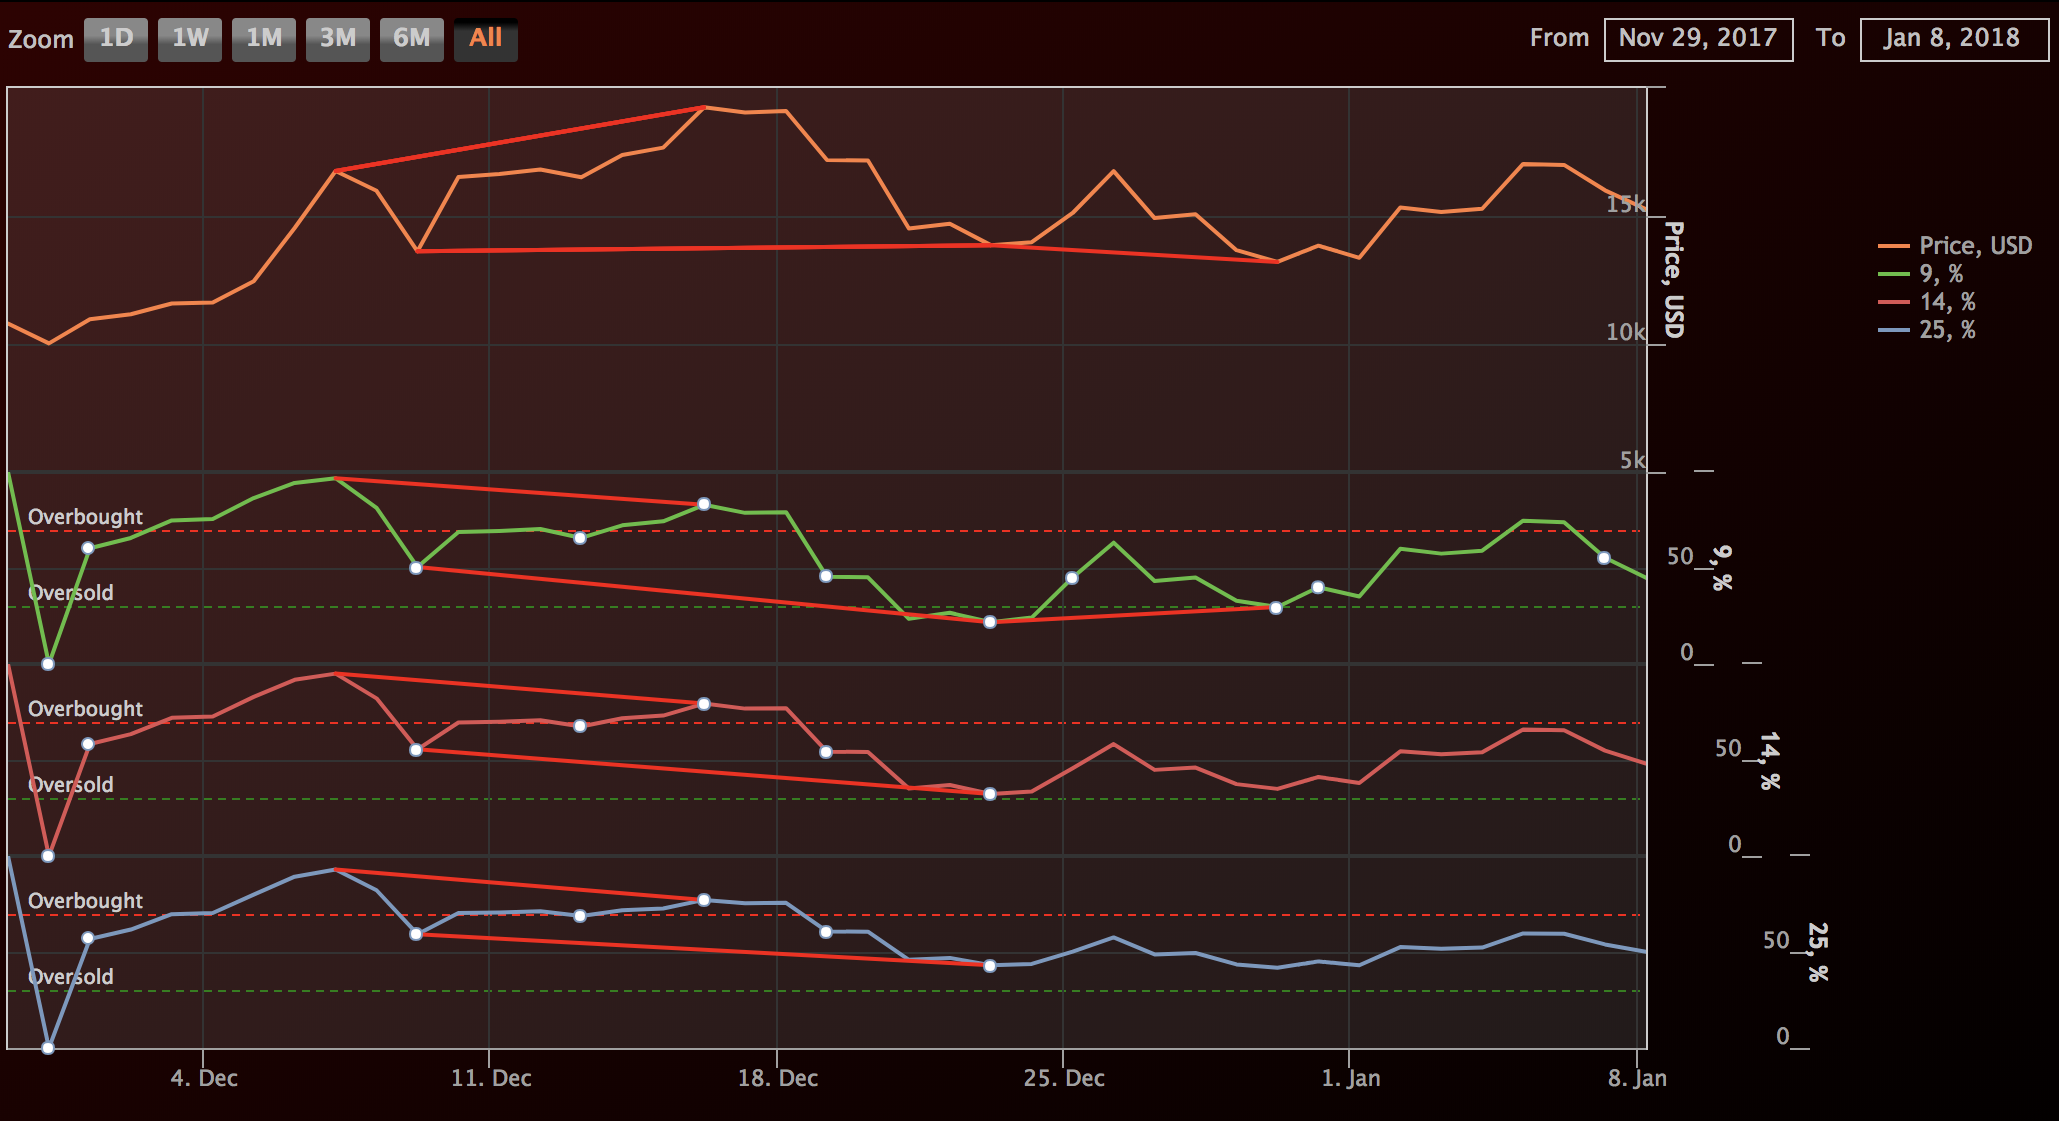
Resistance and Support Levels
Support and resistance levels are considered the most commonly used cryptocurrency market analysis technique. For her, there are special indicators that are based on a simple concept. They determine the levels of support for coins and resistance, which allows you to make more accurate forecasts of growth or drawdown. As a rule, indicators cannot be used to determine when a trend will change. The higher the time interval, the more significant the levels become. It is noteworthy that sometimes support and resistance levels can change places, which indicates a change in trends for a particular cryptocurrency. For convenience, it is better to use portals or utilities that allow you to quickly build a graph for a certain period and determine all the necessary indicators.

Technical Analysis Figures
Another popular technique for technical analysis is working with shapes. As a rule, the graph of a coin is built on certain trends that make it possible to make predictions in the future. The figure is a certain characteristic drawing that describes the change in the value of a cryptocurrency instrument. Based on the repetition of such images, experienced traders can make predictions. The most common figures are:
- Head and shoulders. This figure is most often found after prolonged growth dynamics. It includes three peaks in a row, the middle of which is the highest. Two peaks on the sides have approximately the same values.
- Double bottom or double top. The figure appears after the downward dynamics. A double top appears, as a rule, after prolonged growth. By their nature, both figures are identical, but are turned up or down. As a rule, a classic double bottom portends at least a small change in the direction of the trend.
- Rectangle. Such a figure is rare, but it is almost impossible not to notice it. Its distinctive feature is a flat line of resistance and support, signaling a sharp increase in value, a stable phase and the same active collapse.
- Flag and pennant. The formation of such a figure indicates an upcoming change in trends. It reflects the period of consolidation as part of a growing trend in the movement of value.
There are a number of other more complex figures, but to understand their construction, you need to know the theoretical foundations of analysis. They, as a rule, are used only in computer processing of information, since they include the ratio of large amounts of data.
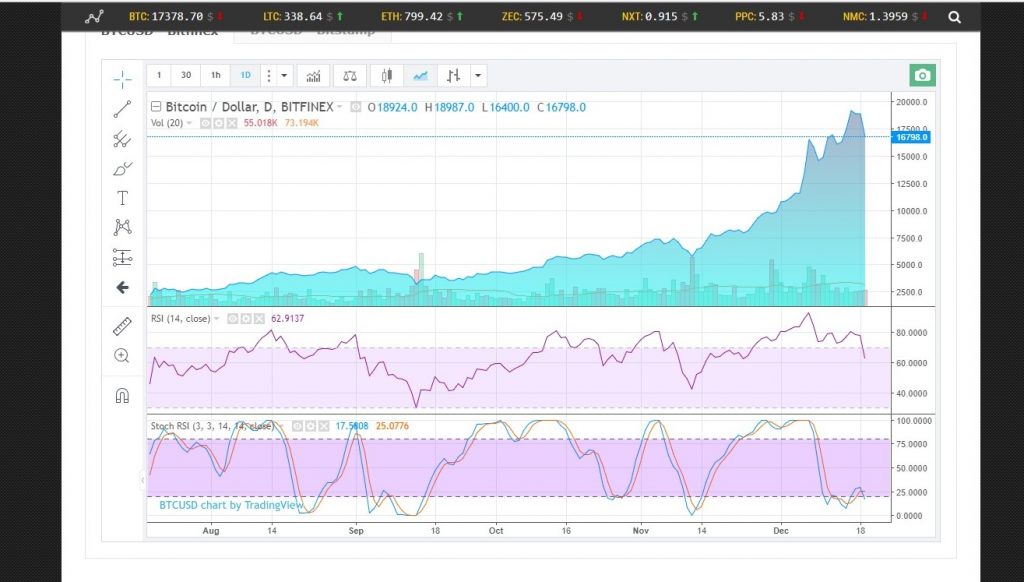
Technical indicators
Technical indicators are a graphical representation of a formula or function. It is impossible to fit all the data into one chart, which is why traders have learned to systematize indicators in order to make the analysis process faster. Therefore, each market participant chooses those indicators that are suitable for his goals or objectives. Over time, so many of them formed that talking about each of them simply makes no sense. There are even special decentralized utilities or web resources for choosing an indicator, which are very easy to use.
The main indicator is RSI, which displays the degree of trend strength. The course can grow rapidly, which will indicate an uptrend, or it may be weak, which will indicate a weak dynamics. RSI allows you to organize data and get clearer characteristics of a process.
Trade volumes
Determining market trends in terms of trading volume is a rather dubious occupation, but in some cases it really brings results. If the activity in the network of a coin is high, then investors pay attention to it. Capitalization growth is likely to affect trend changes, which is also used by experienced traders.
A critical look at analysis
First of all, it is worth remembering that cryptocurrency in its behavior on exchanges is practically no different from fiat. Forecasts do not always come true, which is why it is impossible to carry out mathematical calculations and derive accurate indicators of the course of a coin. Because of this, it is worth relying on the results of technical analysis as a weather forecast that may not come true.
Popular services for the analysis of cryptoeconomics
The most common resource for analyzing the cryptocurrency economy and simply the exchange rate is Coinmarketcap. He constantly publishes his own ratings, determines profitability, activity of traders and much more. In second place is the Cryptocompare portal, which has a quality and attended forum. CoinGecko closes the top three.