“The Spring Has Compressed”: Analysts Predict a Surge in Bitcoin Volatility
 Digital gold volatility has reached a historic low. Weekly Bollinger Bands have tightened to a record-low range, noted analyst Mr. Anderson.
#Bitcoin's weekly Bollinger Bands are now the tightest in history.
What does that mean? On the weekly scale, each candle represents a week, and when volatility compresses this tightly, expansion always follows.
Bollinger Bands measure volatility by tracking two standard… pic.twitter.com/I41cwuHFF5
—Mr. Anderson (@TrueCrypto28) September 23, 2025
He added that after the expansion begins, the price of the first cryptocurrency almost always quickly tests the outer boundaries of the bands.
An analyst using the pseudonym Frank pointed out that Bitcoin's monthly implied volatility remains near historical lows, at 30.9%.
One-month implied volatility for $BTC remains at historic lows of 30.9%.
The closest parallel was the 2023 “Stablecoin Summer” when BTC chopped sideways between $26k and $29k for what seemed like eternity. pic.twitter.com/03tvveE1PH
— Frank (@FrankAFetter) September 20, 2025
He drew a parallel with the “summer of stablecoins” of 2023, when the price of the first cryptocurrency moved sideways for a long time between $26,000 and $29,000.
CoinW exchange Chief Strategy Officer Nassar Achkar agrees, calling the situation “the calm before the storm.” He believes that negative funding rates, seasonal trends, and the influx of funds into institutional ETFs favor growth.
“Such a strong compression rarely goes smoothly,” noted Hunters of Web3 founder Langerius.
However, Glassnode researcher CryptoVizArt shares a different view. He stated that overall volatility is declining because Bitcoin is becoming “larger” over time.
I truly believe there is a connection between lack of knowledge in math/statistics and blindly efficient technical indicators as predictive tools.
Bollinger bands ~ Realized Volatility
Bitcoin has been becoming larger and larger, hence less volatile. No matter weekly, monthly,… https://t.co/02WdbxjfWx
— CryptoVizArt.₿ (@CryptoVizArt) September 23, 2025
Therefore, the narrowing of Bollinger Bands is simply an observation without any real predictive value, the expert noted.
Historically, strong contractions have been followed by gains. In early July, the bands were very narrow, when the asset was trading around $108,000. A few days later, volatility increased, and the price of digital gold reached a new all-time high above $122,000 on July 14.
CryptoQuant's head of research, Julio Moreno, attributed the price weakness to whale activity.
One reason why Bitcoin prices have weakened.
Whales are net selling:
🔸 -147K Bitcoin since August 21.
🔸Total balance declining at the fastest monthly rate of the cycle. pic.twitter.com/w7mTI37BF2— Julio Moreno (@jjcmoreno) September 23, 2025
According to his data, large holders have sold 147,000 BTC since August 21. The whales' overall balance is declining at the fastest monthly rate in the current cycle.
Other experts cite data from CoinGlass: Bitcoin has risen in price in 10 of the last 12 Octobers and in eight of the last 12 fourth quarters.
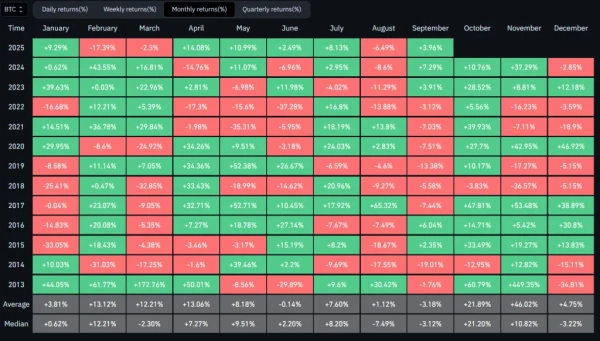 Source: CoinGlass.
As a reminder, in September, CryptoQuant analyst Maartunn noted a worrying sign: many key bull market indicators had turned bearish.
Glassnode experts later identified the short-term holders' coin price as a key support level for digital gold.
Source: cryptonews.net