Q3 Bitcoin Mining Map Shows Quiet Surge in Russia and China, While US Sees Slight Decline

By the end of Q2 2025, the US retained its first place in Bitcoin hashrate share, although it had slightly decreased its figures – by only 0.60% since May 27. At the same time, Russia increased its share in Q3, showing a growth of 6.12% since the same date in May.
Hashrate Power: Russia Leads, US Retains Lead
The global Bitcoin mining heat map from hashrateindex.com provides a visual representation of where the majority of mining power is located. The last time Bitcoin.com News covered the map was on May 27, 2025, when Q2 was in full swing. Now, as Q3 begins, there has been a significant change. The United States still holds the top spot, appearing in the darkest color on the map, with 35.81% of the global hashrate.
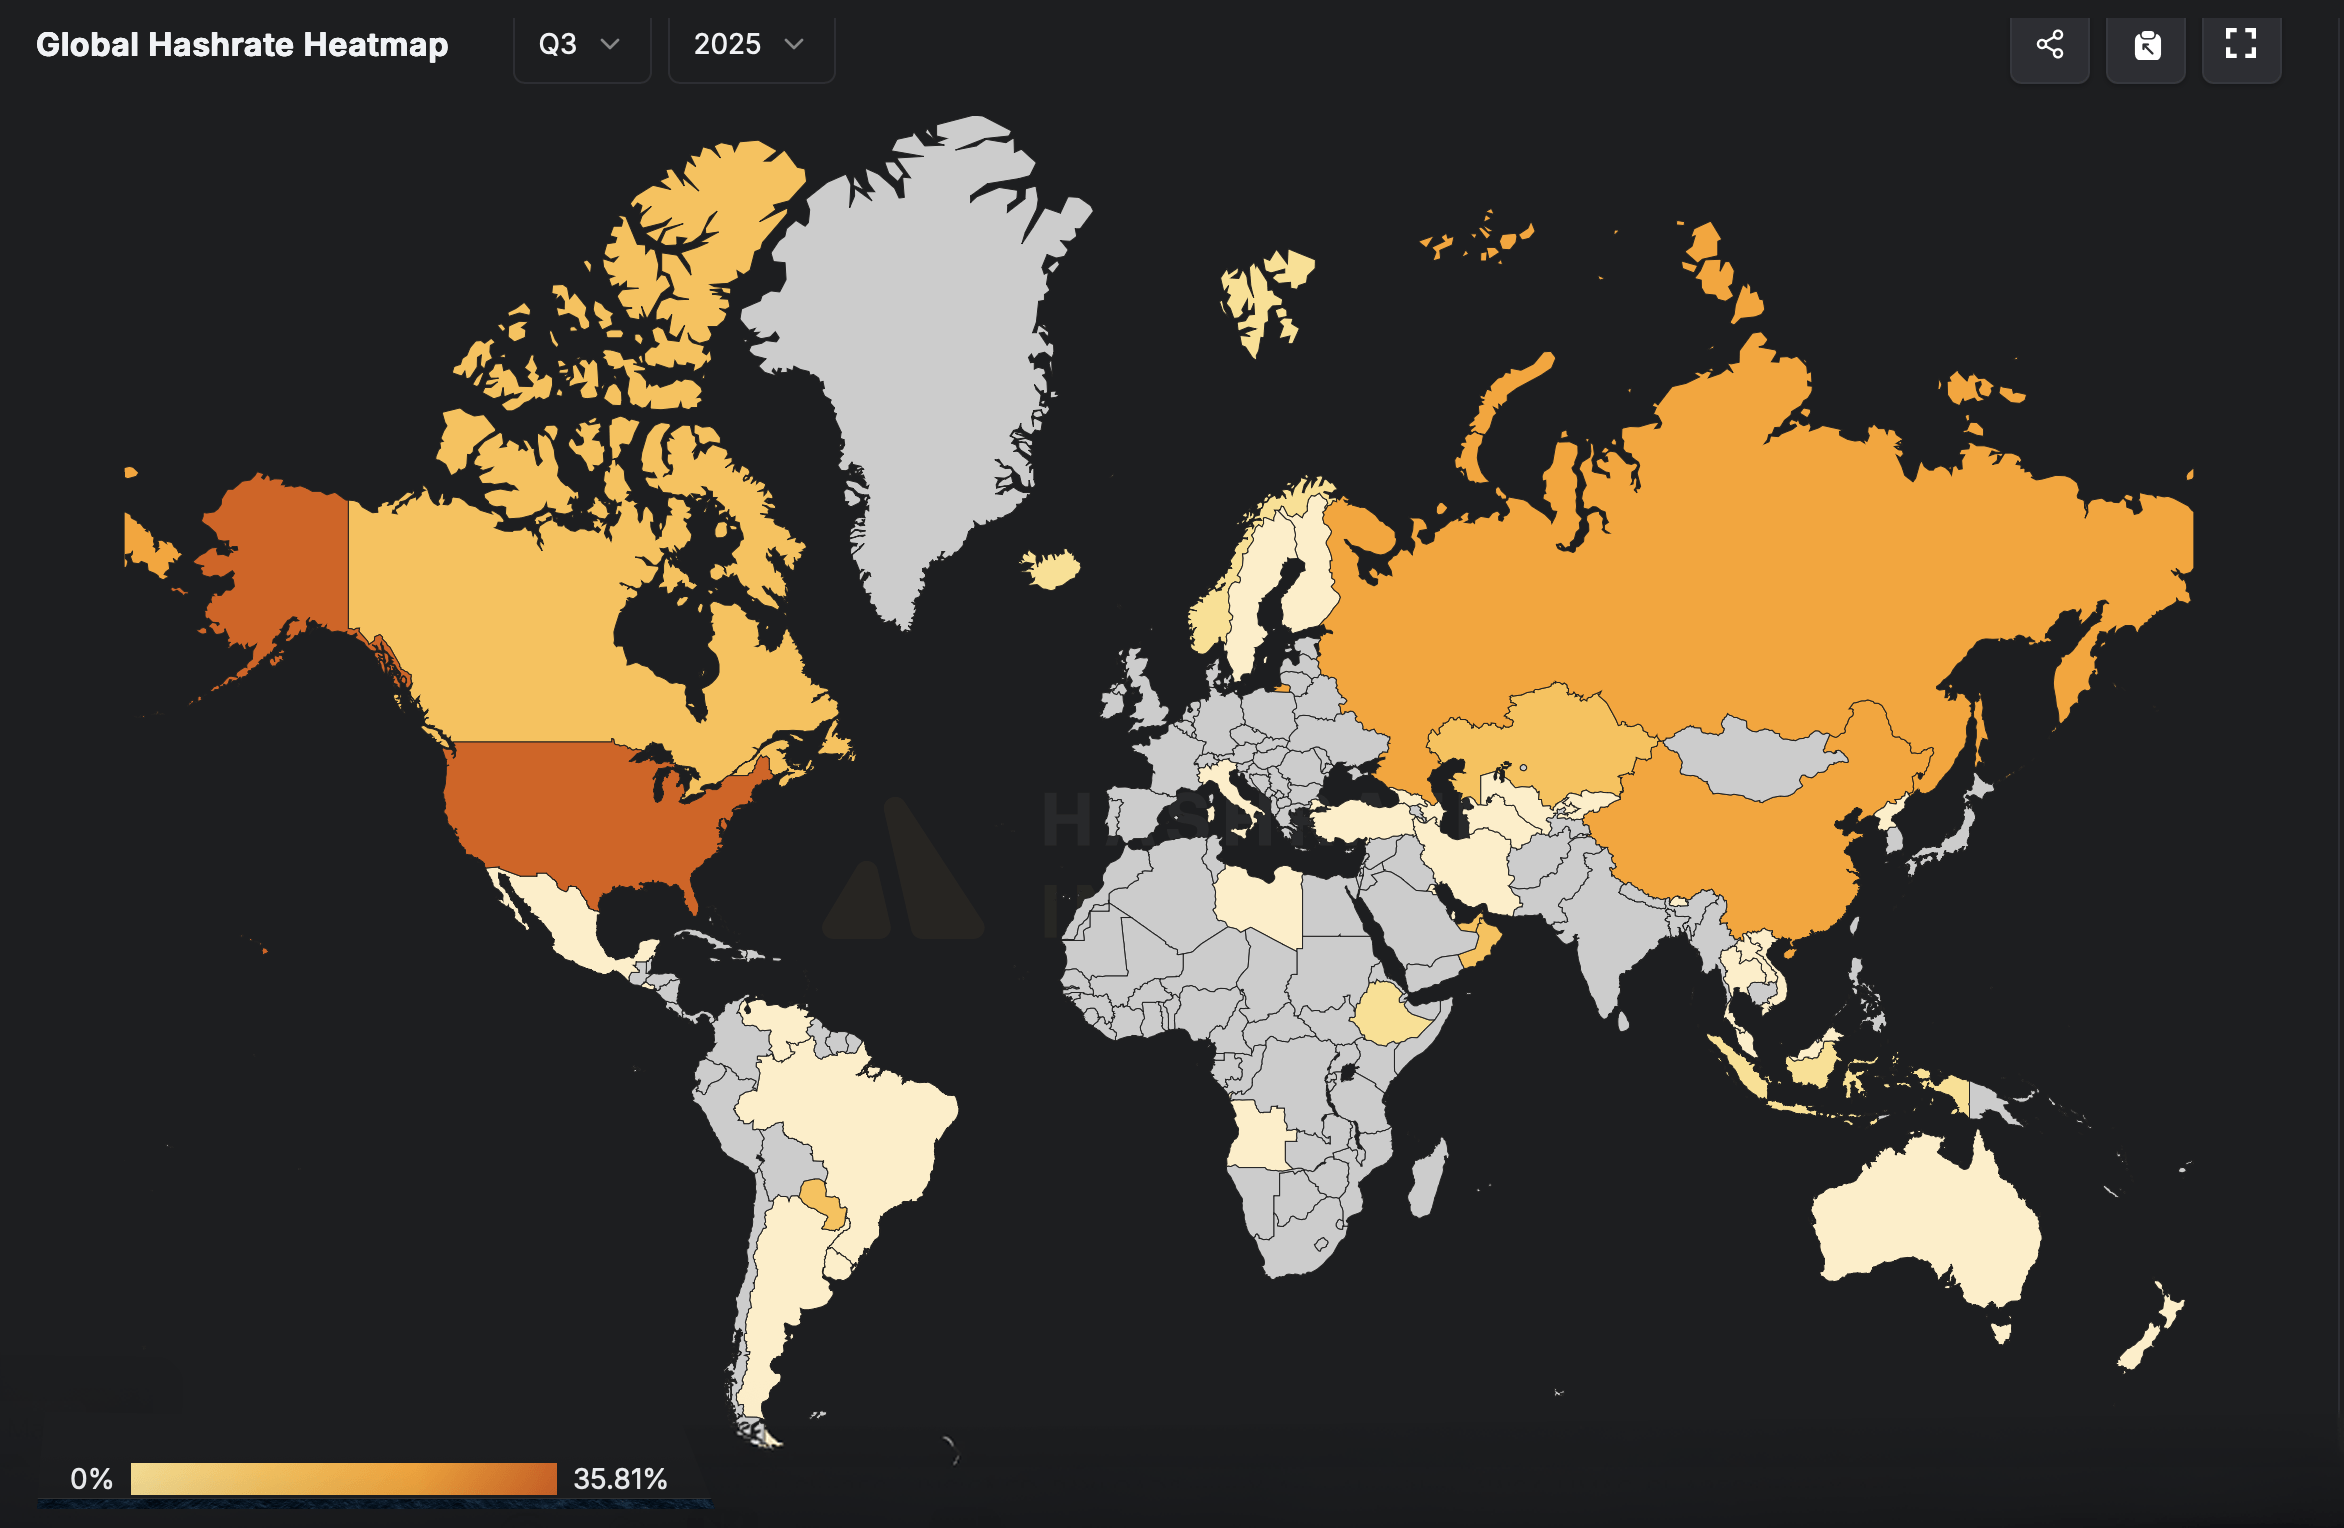 Heatmap source: hashrateindex.com
However, this is a slight decrease from our previous report, where the US had a share of 36.025%, which also indicates a 0.60% decrease since the beginning of the new quarter. Currently, the US has 323.4 exahashes per second (EH/s), remaining the leader in total computing power despite a slight decrease in hashrate share. Other significant participants include Russia and China, marked in dark orange shades, indicating their significant presence in mining.
Russia, in turn, showed growth of 6.12%, increasing its share from 15.652% to 16.61%, and now has an impressive 150 EH/s of pure mining power. China’s share increased from 13.727% to 13.84%, reaching 125 EH/s of hashrate. Paraguay occupies 3.87% of the global total, which corresponds to 35 EH/s, while the United Arab Emirates (UAE) occupies 3.54% with a capacity of about 32 EH/s.
Meanwhile, Oman has a 2.99% share of total production, with Canada following closely behind at around 2.935%. At the same time, much of Africa, Central Asia and the Middle East remains largely inactive or unreported, marked in grey. Notably absent from the map are countries such as Greenland, North Korea and parts of Central Africa, where mining activity is either negligible or data is lacking.
The map highlights a clear geographic imbalance, with North America, parts of Europe, and Asia dominating the global distribution of Bitcoin hashrate. Recent changes in hashrate point to growing competition. While the US still leads, Russia’s strong growth signals a possible power struggle. As Q3 progresses, the real story may be about who’s quietly gaining traction behind the scenes, rather than just taking center stage.
Source: cryptonews.net