Bitcoin Technical Analysis: Bulls and Bears Battle Over Market’s Next Direction – Markets and Prices Bitcoin News

Bitcoin’s price was $94,372 on Jan. 11, 2025, with a market cap of $1.86 trillion. Daily trading volume reached $52.92 billion, with intraday fluctuations between $92,275 and $95,798.
Bitcoin
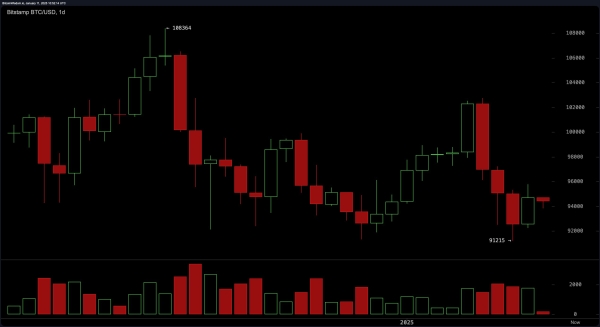
The daily chart illustrates a prevailing bearish tone after a sharp retreat from a high near $108,364. The price rebounded from a $91,215 low to consolidate around $94,000. Support at $91,000 holds firm, while resistance at $95,000 remains intact, forming a critical juncture for traders. Indicators such as the moving average convergence divergence (MACD) at −445 and momentum at 31 point to bearish sentiment, signaling caution for bullish positions without clear validation.

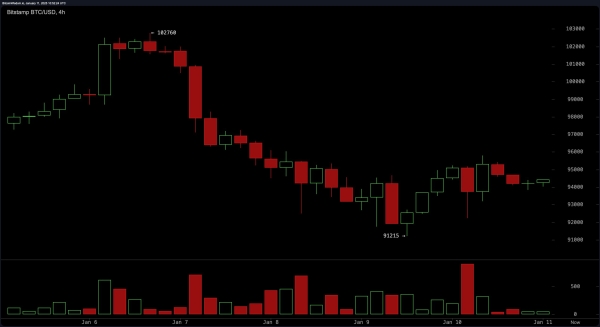
On the 4-hour chart, bitcoin shows short-term stabilization, oscillating between $94,000 and $95,000 following a plunge from $102,760 to $91,215. The relative strength index (RSI) at 46 and Stochastic oscillator at 23 suggest neutrality, while the 10-period exponential moving average (EMA) at $95,702 indicates bearish conditions. Volume surges during pivotal movements highlight active trading, emphasizing the importance of a breakout above $96,000 as a key event to watch.

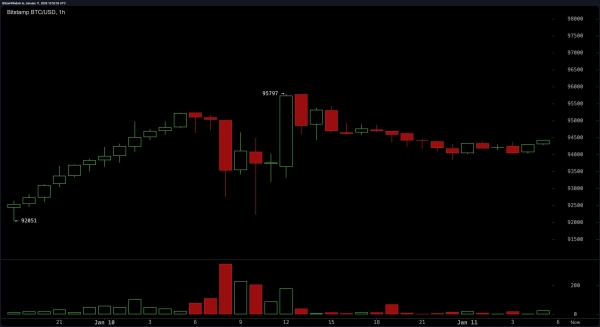
The hourly chart offers a granular perspective, revealing coiling price action with descending highs and ascending lows. Resistance at $95,800 and support near $93,500 outline a narrow range, often a precursor to significant movement. Lower trading volumes suggest dwindling momentum, but a decisive move beyond these thresholds—accompanied by strong volume—could provide actionable insights for short-term traders.

Across timeframes, moving averages (MAs) paint a mixed picture. Shorter-term signals, such as the 10-day simple moving average (SMA) at $96,748, suggest bearish momentum, contrasting with the longer-term optimism of the 200-day EMA at $78,285. This interplay reflects the tension between immediate bearish pressures and enduring bullish trends, with the $91,000 support level remaining pivotal to preventing further declines.
Traders should remain vigilant, as current consolidation patterns could result in deceptive breakouts. A push above $95,800 could signify renewed bullish momentum, while a dip below $93,500 risks exacerbating bearish trends, particularly if $91,000 support falters. Employing stop-loss strategies and confirming volume patterns will be essential in navigating bitcoin’s current market dynamics.
Bull Verdict:
Bitcoin’s current consolidation near $94,000 suggests the potential for a bullish breakout, particularly if the price decisively moves above $95,800 with robust volume. The resilience of the $91,000 support level and the longer-term bullish trend indicated by the 200-day EMA reinforce optimism for upward momentum. A confirmed breakout above $96,000 could attract fresh buying interest, paving the way for a test of higher resistance levels.
Bear Verdict:
Persistent bearish indicators, such as the MACD at −445 and the short-term SMA signaling downward pressure, underline the risk of further declines. A break below $93,500 could intensify selling, with the $91,000 support level being the critical line of defense. Failure to hold this level could lead to deeper losses, as bearish momentum consolidates its grip on the market.


