XRP Market Update: Traders Brace for Action as Key Levels Tighten – Markets and Prices Bitcoin News

XRP is presently priced at $3.13, commanding a market capitalization of $180 billion and a 24-hour trading volume of $2.53 billion. Its intraday price movement has fluctuated narrowly within the bounds of $3.11 and $3.14, reflecting measured activity.
XRP
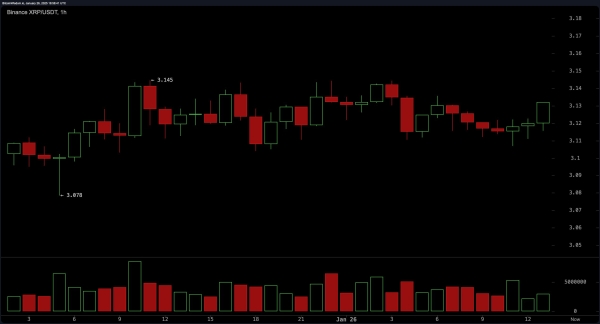
On the one-hour chart, XRP exhibits a period of consolidation, with prices oscillating within the constrained range of $3.11 to $3.15. Recent candlestick formations are devoid of decisive momentum, suggesting a lull in trading dynamics. Sporadic volume upticks have aligned with incremental price adjustments, signaling a cautious stance among market participants.

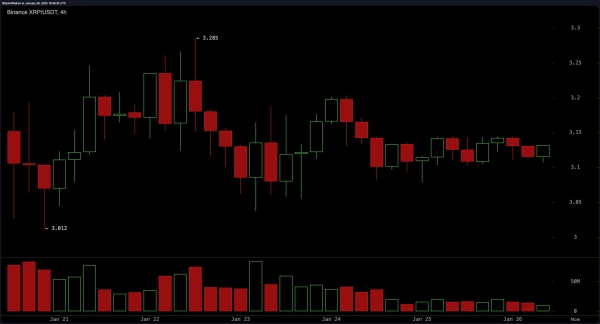
The four-hour chart delineates a broader range, bounded by $3.00 and $3.28, with a pattern of diminishing highs pointing to either a waning bullish impetus or the emergence of bearish sentiment. Trading volume, while moderate, fails to deliver clear indications of a directional breakout. Conservative traders may look to initiate buy orders near $3.10 with a narrowly placed stop-loss at $3.00, or alternatively await confirmation of upward momentum above $3.28 before entering long positions.

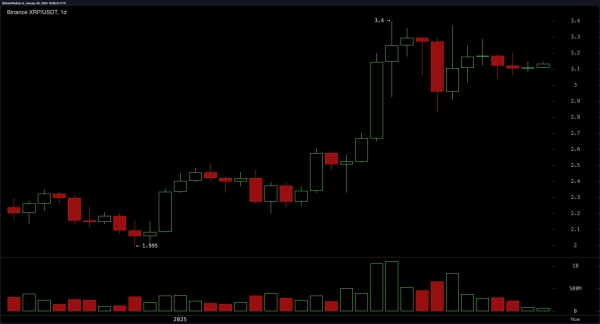
On the daily chart, XRP maintains its overarching bullish trajectory, with prices consolidating between $3.10 and $3.20. Over recent weeks, its ascent from $2.00 to $3.40 underscores sustained upward momentum. However, during the current consolidation phase, volume trends reveal a tapering pattern, indicative of diminished trading activity. Should the price surpass $3.40, it may signify a continuation of the prevailing uptrend. Conversely, a decline below $3.00 could imply a potential shift in sentiment toward a reversal.

Technical oscillators offer further context. The relative strength index (RSI) at 63.91 and the Stochastic (14, 3, 3) at 73.20 both rest in neutral zones, suggesting a lack of definitive directional bias. Similarly, the commodity channel index (CCI), average directional index (ADX), and awesome oscillator reflect neutrality, corroborating the broader consolidation theme. However, the momentum indicator’s sell signal at -0.11, paired with the moving average convergence divergence (MACD) reading of 0.21, hints at a slight inclination toward bearish pressure.
Moving averages present a more nuanced perspective. The exponential moving averages (EMA) for the 10, 20, and 30 periods emit buy signals, indicating an underlying bullish sentiment. The simple moving average (SMA) for 10 periods, by contrast, signals a sell, while SMAs for 20, 30, 50, 100, and 200 periods suggest a favorable long-term outlook. Collectively, these indicators suggest that while short-term consolidation persists, the long-term trajectory remains skewed toward optimism.
Bull Verdict:
XRP’s long-term trajectory retains a bullish bias, supported by its steady uptrend and buy signals across most moving averages. A breakout above $3.40 on the daily chart would reinforce upward momentum, signaling the potential for further gains. Traders aligned with bullish sentiment may look for buying opportunities at key support levels, particularly near $3.10 while anticipating a continuation of the broader rally.
Bear Verdict:
Despite the longer-term uptrend, the short-term consolidation and lack of decisive momentum, as reflected in neutral oscillators and tapering volume, suggest caution. A breach below $3.00 could trigger a reversal, with bearish sentiment gaining traction. Traders with a bearish outlook should monitor for price weakness below $3.10 as an early warning of potential downside risks.


