Bitcoin Technical Analysis: Higher Lows Signal a Bullish Breakout Beyond $108K – Markets and Prices Bitcoin News

At press time, bitcoin’s market capitalization is $2.03 trillion, and its current price is cruising along at $102,536 to $102,739 in the last hour. Its 24-hour trading volume is $62.38 billion, and its intraday price has fluctuated between $97,532.25 and $102,629.
Bitcoin
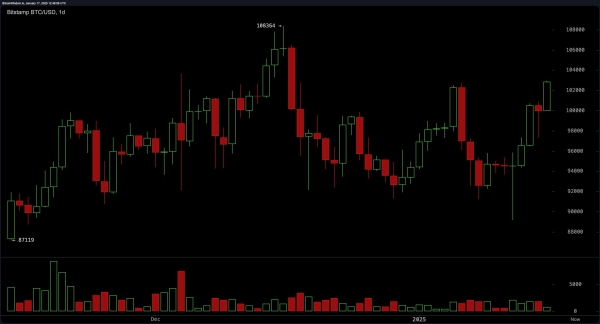
Bitcoin‘s daily chart reveals a period of tight consolidation around the $102,000 mark, following a rebound from a low of $87,119 and a high of $108,364. The pattern of higher lows indicates a continuation of bullish momentum. Both exponential and simple moving averages (EMAs and SMAs) across all timeframes suggest favorable conditions for buying. Resistance remains firm at $108,000, while support holds near $98,000, forming critical levels to monitor.

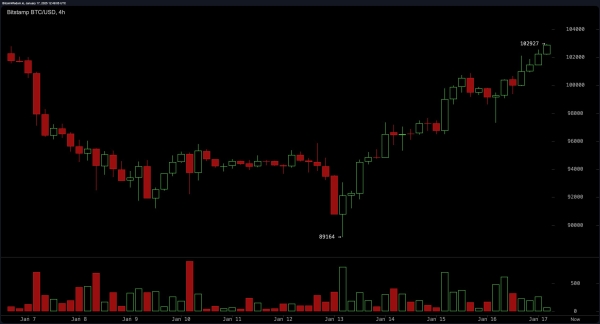
Zooming into the 4-hour chart, bitcoin has demonstrated a sharp recovery from $89,164, though upward progress is currently restrained by resistance at $102,927. Volume data points to consistent buyer activity during price increases. Moving averages, including the 50-day EMA at $95,217, further confirm an upward trajectory. Potential entry zones could materialize between $98,000 and $100,000, contingent on confirmation of bullish signals.

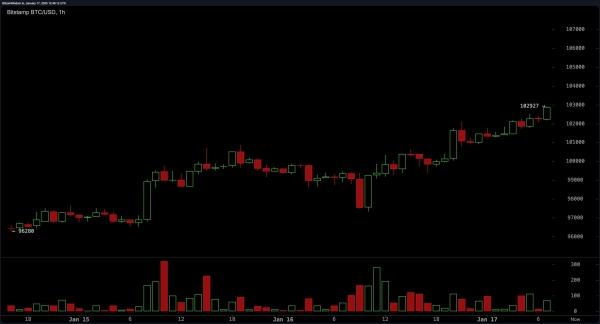
On the 1-hour chart, the formation of higher highs and higher lows underscores short-term bullish momentum. Breakouts are accompanied by steady volume, signaling sustained buying interest. Resistance remains at $102,927, with possible entry points identified between $101,000 and $101,500 during pullbacks. Setting a stop-loss at $100,000 is advisable to mitigate risk.

Oscillators provide a mixed yet largely optimistic perspective. The relative strength index (RSI) holds steady at 63, while the Stochastic at 88 and commodity channel index (CCI) at 158 remain neutral, pointing to neither overbought nor oversold conditions at present.
On the other hand, the awesome oscillator at 237 and momentum at 5,967 indicate strong buy signals, reinforcing the broader bullish outlook. The moving average convergence divergence (MACD) level, sitting at 723, further emphasizes upward momentum, supported by a positive histogram and a widening gap from the signal line.
Moving averages (MAs) across all major timeframes continue to point toward a bullish trend. Short-term EMAs, such as the 10-day and 20-day values at $98,147 and $97,358 respectively, indicate immediate upward pressure. Meanwhile, longer-term indicators, including the 50-day EMA at $95,217 and the 200-day EMA at $79,447, reinforce the prevailing strength.
Similarly, SMAs align with this outlook, highlighting the persistence of the trend. Together, these metrics suggest bitcoin remains well-positioned for further upward movement, provided that volume sustains its current levels and resistance levels are effectively managed.
Bull Verdict:
Bitcoin’s sustained higher lows, strong support at $98,000, and alignment of moving averages across all timeframes signal a continuation of bullish momentum. If volume remains consistent and resistance at $108,000 is breached, the cryptocurrency appears poised for further upward movement in the near term. Entry points between $98,000 and $101,500 offer potential opportunities for buyers, with key levels suggesting optimism for continued gains.
Bear Verdict:
While bitcoin shows signs of strength, the resistance at $108,000 and capped upward momentum at $102,927 could lead to a potential pullback. A break below $98,000 would challenge the current uptrend, and declining volume during key price levels could further signal weakness. Traders should remain cautious, as a dip toward the 50-day EMA at $95,217 or even the 200-day EMA at $79,447 could shift sentiment to a bearish outlook.


