Bitcoin Technical Analysis: Bears Tighten Grip as Price Flirts with $93,000 Support – Markets and Prices Bitcoin News

Bitcoin, clocking in at $94,504 with a market cap of $1.87 trillion, witnessed a 24-hour trading session of around $53 billion, bouncing between $93,368 and $97,133 over the past day.
Bitcoin
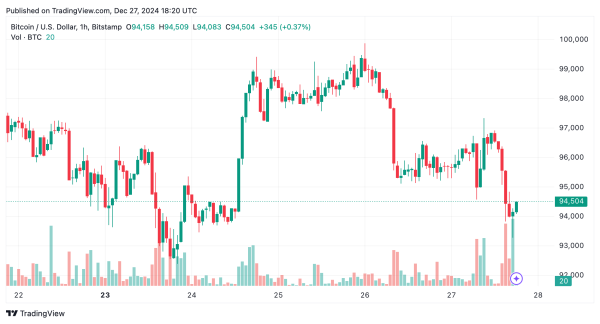
The one-hour chart showed bitcoin taking a nosedive from its recent peak near $98,000, with hefty sell-offs pushing it toward the safety net at $93,000. Resistance levels are perched at $95,000 and $96,500, while the relative strength index (RSI) at 44 and the Stochastic at 26 keep things in the middle ground. The 10-period exponential moving average (EMA) at $97,282 echoes the bearish vibes all around.

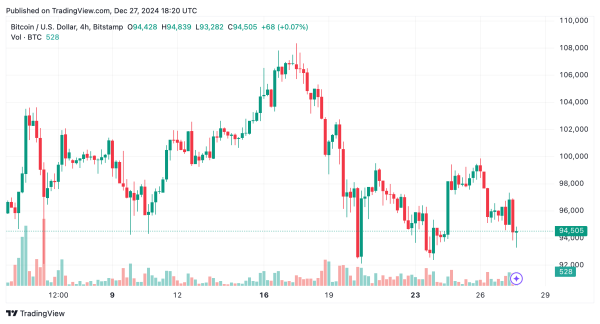
Over on the four-hour chart, bitcoin’s been painting a picture of lower highs and lows since hitting $99,881, with consistent sell-offs hinting at more bearish vibes ahead. Support zones are peeking out at $93,500 and $92,500, with resistance flirting around $96,000 and $98,000. Indicators like the momentum oscillator at -12,125 and the MACD level at 233 are waving red flags, advising medium-term traders to tread carefully until prices stabilize.

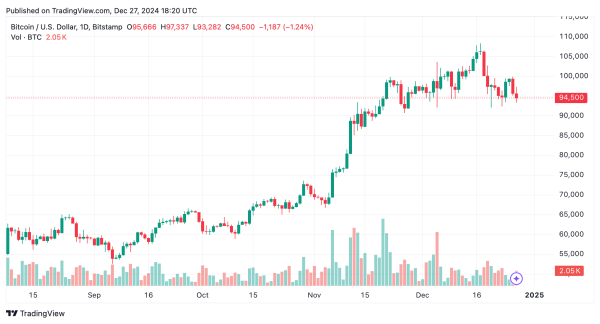
The daily chart gives us a broader view of bitcoin’s correction from its Dec. high of $108,364, characterized by intense selling and bearish candles. The $92,000 support has been a savior in the past, while resistance at $100,000 and $108,000 beckons as future goals. The 100 and 200-period moving averages, particularly the EMAs at $84,785 and $75,451 respectively, whisper optimism offering a sliver of hope for those with patience.

Despite the overarching bearish trajectory, if bitcoin decides to hang out near its $93,000 support with less sell-off drama, short-term opportunities could spark. Medium-term traders might look to jump ship around $96,000, while long-term investors could keep their eyes peeled for a turnaround at $92,000, setting their sights on $100,000 or higher.
Bull Verdict:
If bitcoin consolidates above $93,000 with declining selling pressure, the price could rebound toward $96,000 or higher, with long-term targets at $100,000 and $108,000 supported by buy signals from the 100-period and 200-period moving averages. Investors may find opportunities for gradual accumulation at these levels, anticipating a recovery.
Bear Verdict:
The prevailing bearish indicators across all timeframes, combined with selling pressure highlighted by the MACD and momentum oscillator, suggest a likely retest of support at $92,000. A break below this level could accelerate declines, exposing bitcoin to further downside risk. Caution remains crucial for all market participants.


