Bitcoin Technical Analysis: Market Indecision Holds Prices in a $3K Range – Markets and Prices Bitcoin News

Bitcoin has danced between $95,575 and $96,050 in the past hour, boasting a market cap of $1.87 trillion, with trades totaling $56 billion in the last 24 hours, and prices swinging from $92,441 to $95,674 within the day.
Bitcoin
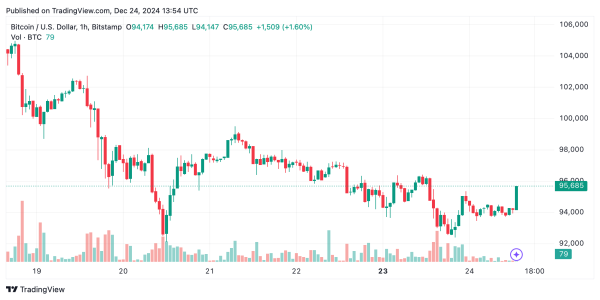
The 1-hour chart shows bitcoin is cozying up near the $95,500 to $96,050 range following a bounce back from $92,389, with candle patterns hinting at a possible ceiling at $96,500. Volume jumps during this recovery spotlight a fresh wave of buying when prices dip, while the awesome oscillator stays neutral and the relative strength index (RSI) at 44 suggests a lull in momentum. The moving averages, like the exponential moving average (EMA) and simple moving average (SMA) for 10 and 20 periods, are waving a flag for a short-term bearish vibe with a tilt towards selling.

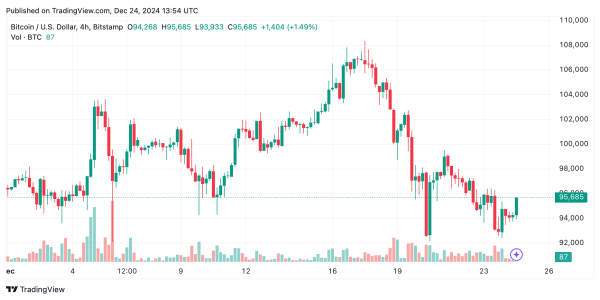
On the 4-hour chart, there’s a clear slide from $105,000 down to $92,000, with a little uptick stalling near $96,000, hitting a significant resistance point. The commodity channel index (CCI) at -129 whispers a positive signal, but the moving average convergence divergence (MACD) at 590 leans towards bearish activity. Strong support at $92,000 might keep things steady unless broken, potentially sending prices tumbling further.

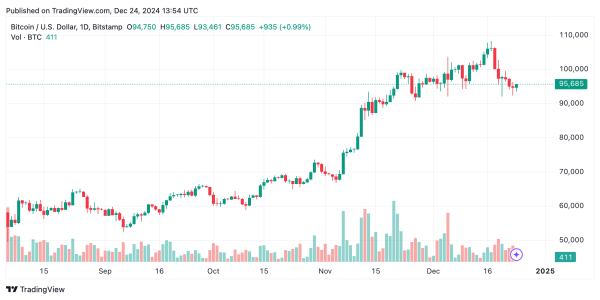
Bitcoin‘s daily chart paints a picture of a continued downward journey from $108,000 to $92,000. A low-volume huddle near $93,000 shows the market’s uncertainty, with a chance for a turnaround if it breaks above $96,500. Oscillators are all over the place, with Stochastic neutral at 17 and momentum at -6,781 screaming sell. The longer-term moving averages, including the 50 and 200 EMAs, hint at slow healing, suggesting the broader trend might find some stability above $92,000.

Oscillators across the board are playing a mixed tune, offering signals from neutral to buy or sell, depending on your timeframe and tool. The RSI, Stochastic, and CCI sing a more neutral or bullish song, whereas momentum and MACD continue to hum a bearish tune. Moving averages nod to short-term selling but wink at bullish possibilities over the long haul, crafting a market outlook that’s balanced yet cautious.
Bull Verdict:
A breakout above $96,500 on the hourly chart, followed by sustained momentum beyond $97,500 on the daily chart, could signal a bullish reversal. This would set the stage for a rally toward $100,000, supported by buying interest near $92,000 and longer-term bullish signals from the 50 and 200 exponential moving averages.
Bear Verdict:
A breakdown below $92,000 across all timeframes could confirm bearish continuation, with potential targets at $88,000 or lower. The prevailing selling pressure indicated by short-term moving averages and oscillators such as momentum and MACD suggests downside risks remain prominent in the current market environment.


