Bitcoin Technical Analysis: Resistance at $106K Sparks Fierce Bull-Bear Battle – Markets and Prices Bitcoin News

Bitcoin’s price held steady at a dazzling $105,080 on Monday, Dec. 16, 2024, with a daily trading volume of $90.85 billion and a market cap hitting $2.05 trillion, while the leading crypto asset by market cap danced between $102,593 and $106,533 throughout the last day.
Bitcoin
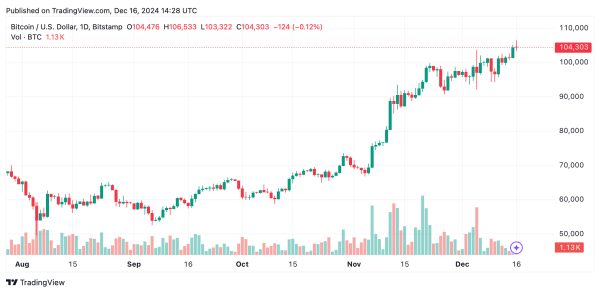
Bitcoin keeps riding the wave of a grand bullish trend, as seen on the daily chart, with a pattern of ever-increasing peaks and troughs. The crypto hit a resistance snag near $106,500, leading to a swift retreat and a temporary dip. Strong support zones hover around $98,000 to $100,000, where trading buzzes during the climb. Even with some patchy volume, the signals from exponential moving averages (EMA) and simple moving averages (SMA) over various time frames shout strong market vibes.

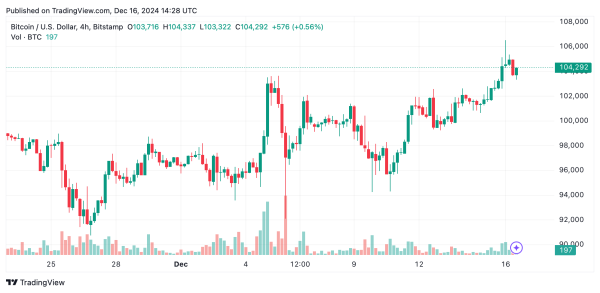
The 4-hour chart shows a clear upward march, with bitcoin touching $106,533 before facing some sell-off heat, marked by significant dips packed with volume. As BTC traders cashed in near resistance points, the price slid back to the $102,000 to $103,000 support area. This could be a sweet spot for re-entry, but dropping below $102,000 might just signal a bearish turn. Oscillators like the relative strength index (RSI) at 66 and the commodity channel index (CCI) at 173 are still playing it cool, showing a market unsure of its next big move in the medium term.

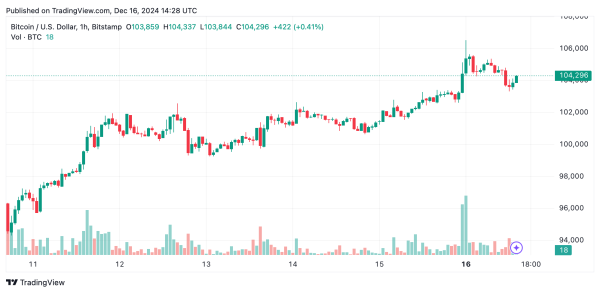
In the short-term, bitcoin’s price hit its all-time high note at $106,533 before making a quick exit stage left. The 1-hour chart points out support from $103,000 to $103,500, where selling picked up, cooling down the momentum. Indicators like the momentum index at 3,983 and the moving average convergence divergence (MACD) level at 3,541 hints at a short-term bearish tilt. Keep an eye on how bitcoin consolidates here; it might spring back or dive further toward $101,500.

Moreover, the moving averages (MAs) are singing a bullish tune, with all key EMAs and SMAs—from the 10-day to the 200-day—still in the positive territory. For example, the 10-day EMA at $101,106 and the 200-day EMA at $72,834 are painting a picture of a vigorous uptrend. These metrics affirm bitcoin’s enduring vigor, suggesting that any dips might just be brief interludes in this larger bullish symphony.
Bull Verdict:
Bitcoin’s price action on December 15, 2024, reflects a strong bullish foundation, underpinned by consistent buy signals across all major moving averages. The overall uptrend and robust support near $98,000 to $100,000 suggest that any short-term pullbacks are likely opportunities for accumulation. A sustained breakout above $106,500 could pave the way for new highs, making the outlook favorable for bullish traders.
Bear Verdict:
Despite bitcoin’s bullish structure, the rejection at $106,500 and signs of profit-taking raise concerns about further downside risk. If the price fails to hold above the critical $102,000 support, it could lead to increased selling pressure, potentially dragging the price toward $98,000. Neutral oscillator readings also reflect indecision, leaving room for a bearish shift if short-term support levels are breached.


