

BTC has retreated from the high-$80K zone back towards $75K as spot demand, ETF inflows, and expectations of volatility diminish. Positioning has recalibrated, yet conviction remains constrained.
Executive Summary
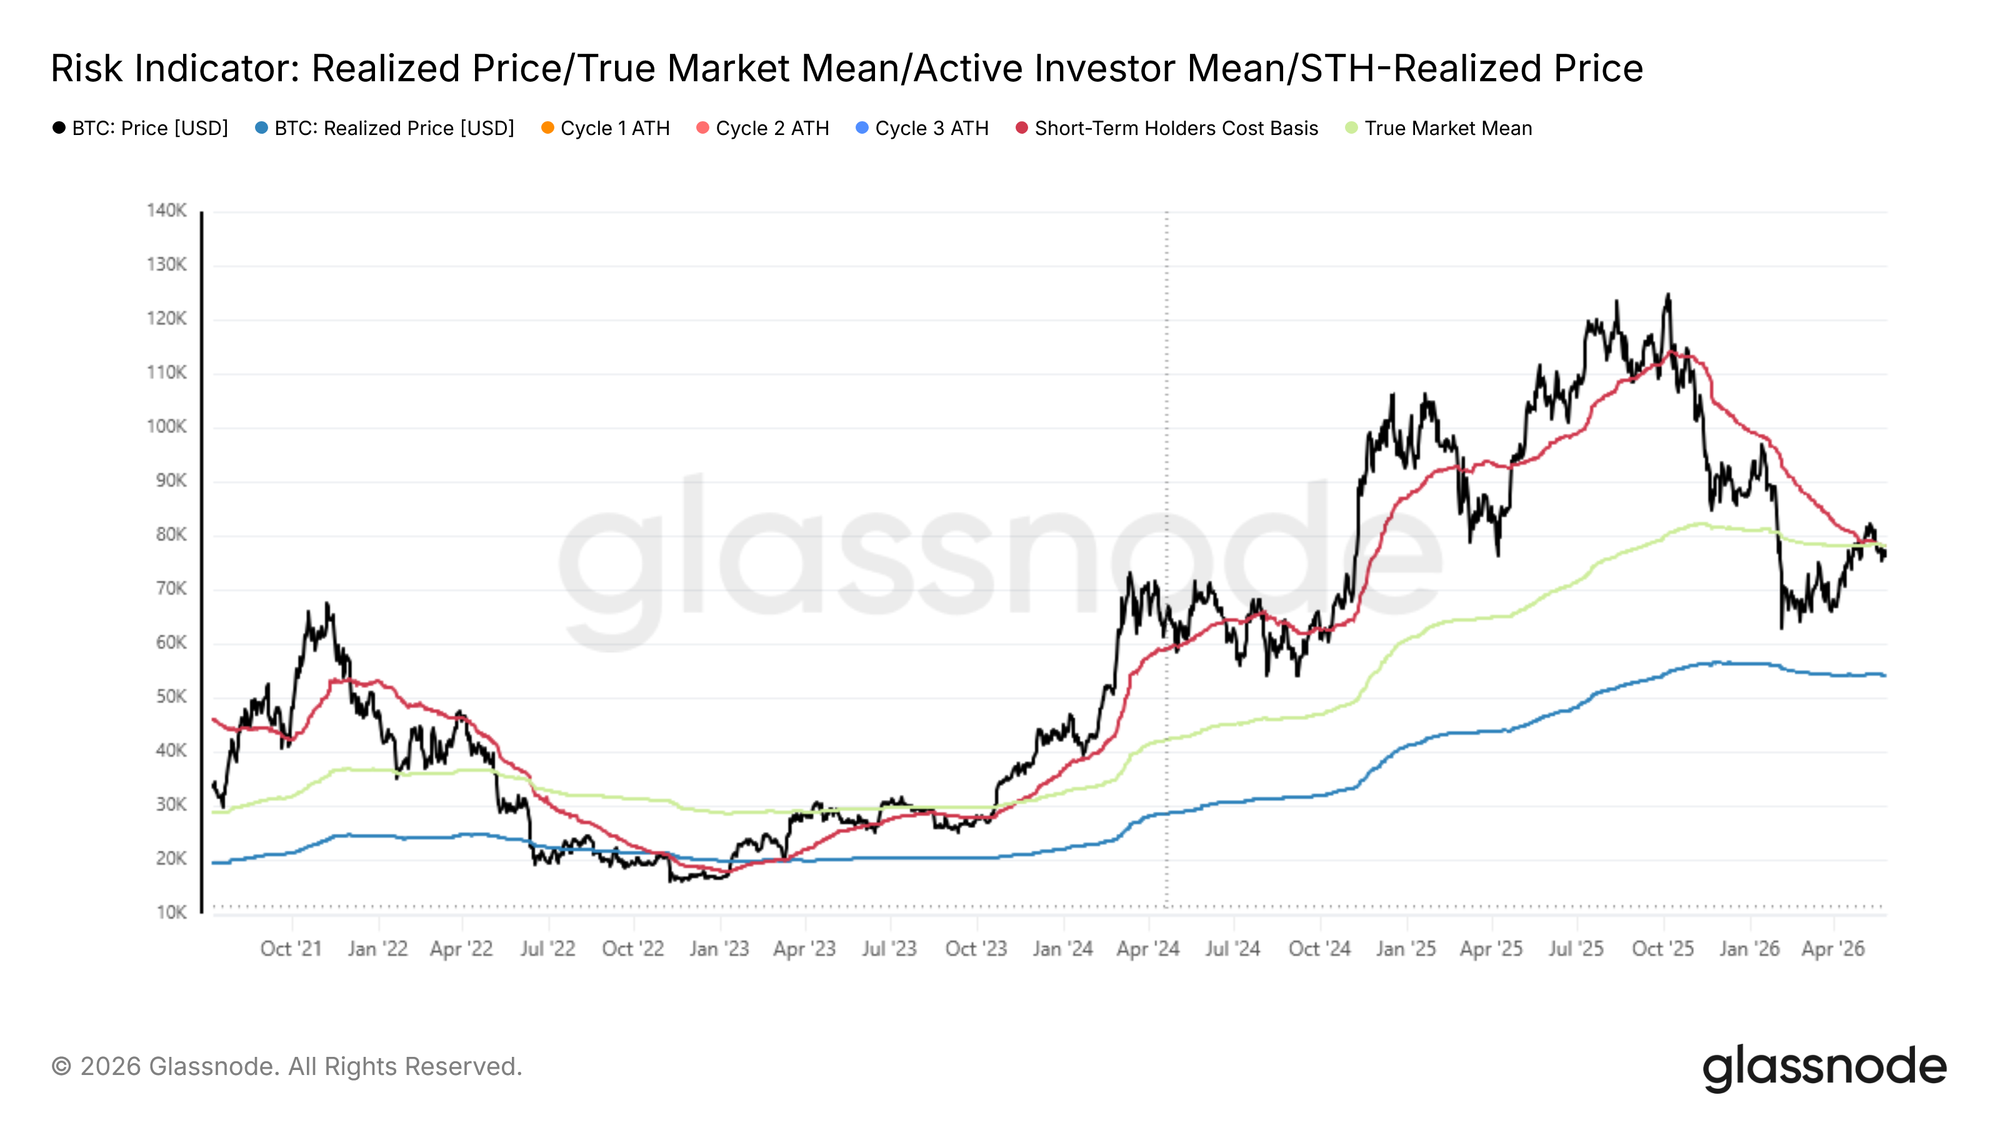
- Bitcoin is stabilizing within the $75k–$78k range, as the Short-Term Holder Cost Basis and True Market Mean converge near $78k, forming an overloaded structure where maintaining a position above the True Market Mean is essential to facilitate a transition prior to a bull market.
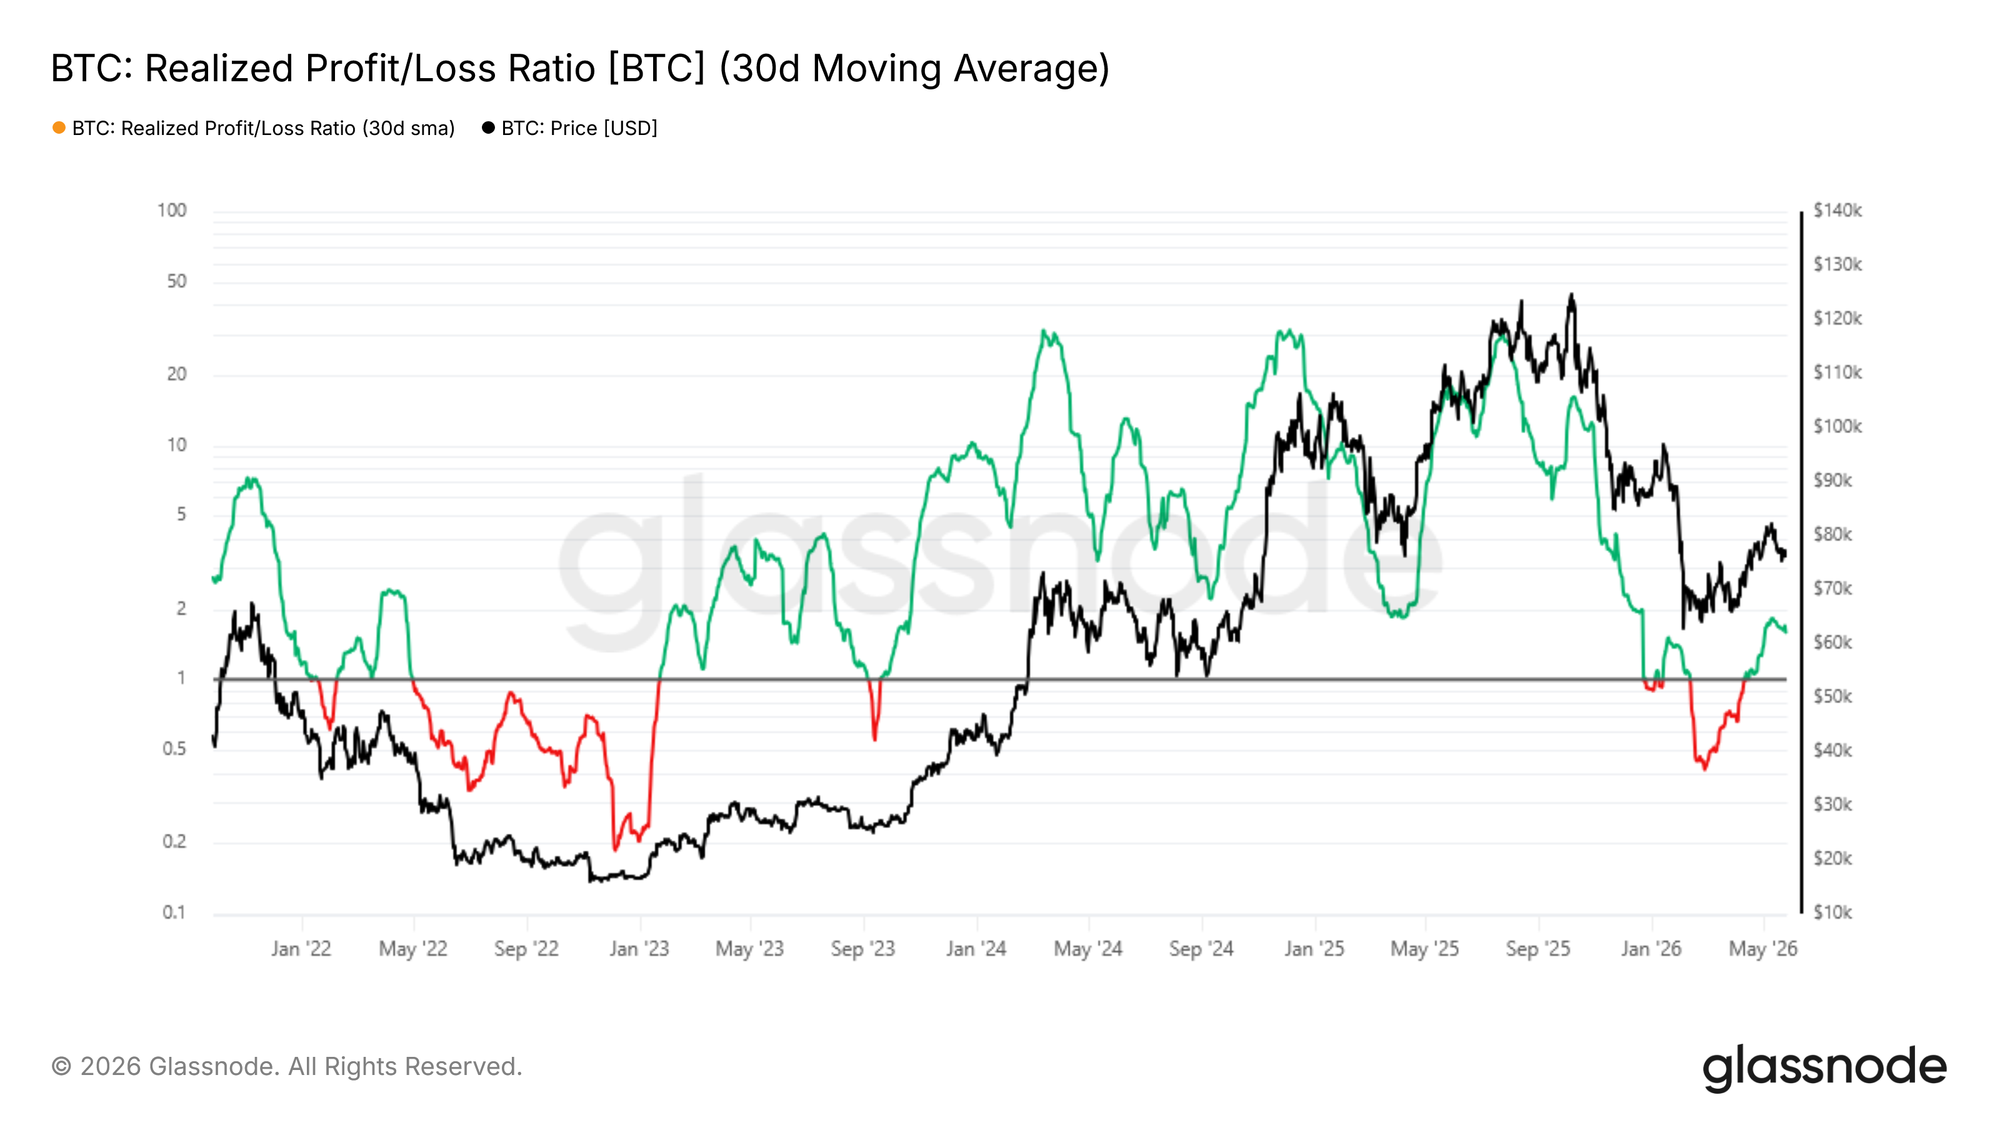
- The Realized Profit/Loss Ratio stands at 1.56, validating a generally positive capital flow environment since the $60k low, yet it remains considerably below the 2 to 5 range historically associated with the initial phases of sustained bull markets.
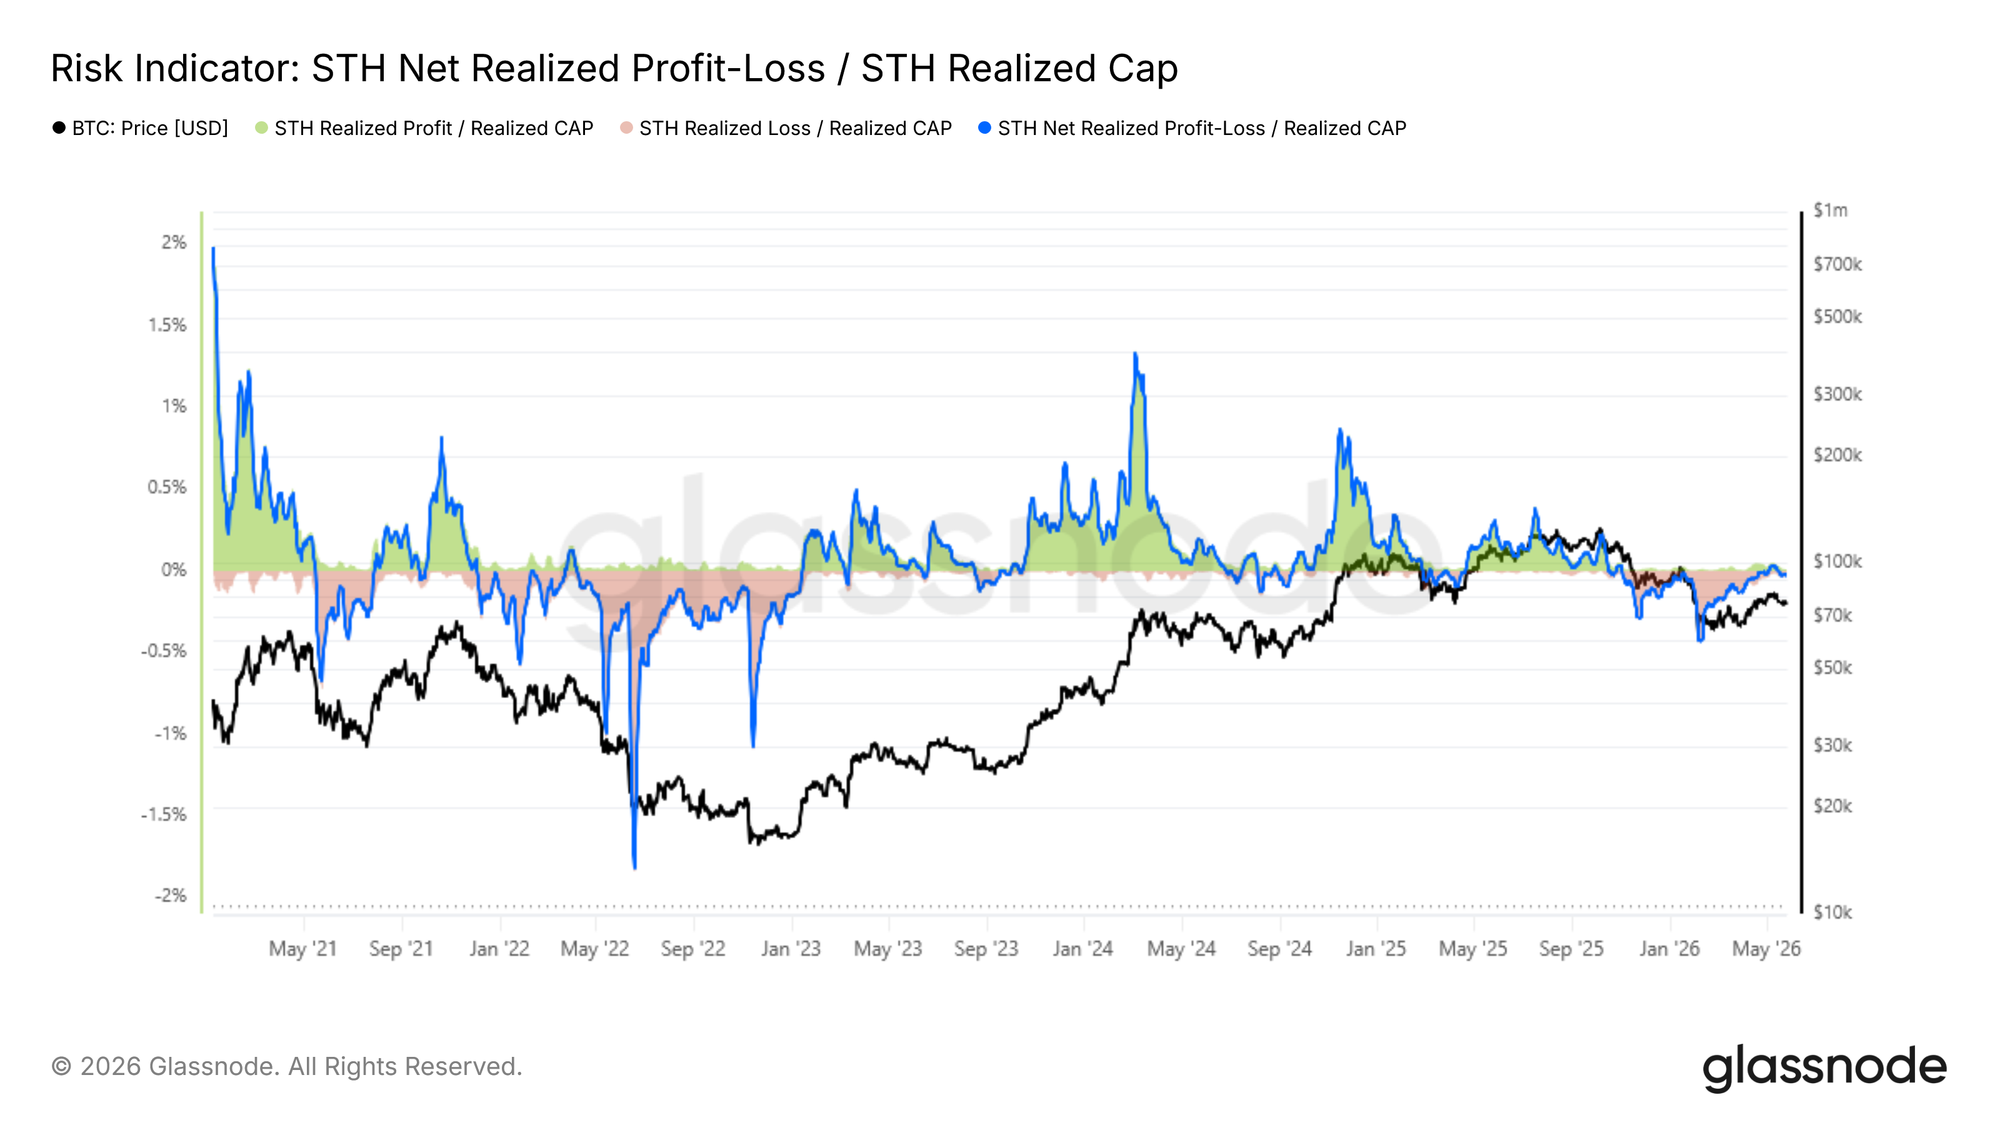
- The STH Net Realized P&L, adjusted by Realized Cap, has improved from -0.44% in February to approximately neutral at -0.02%, indicating enhanced but insufficient capital flow magnitude to sustain expansion beyond the True Market Mean at current price levels.
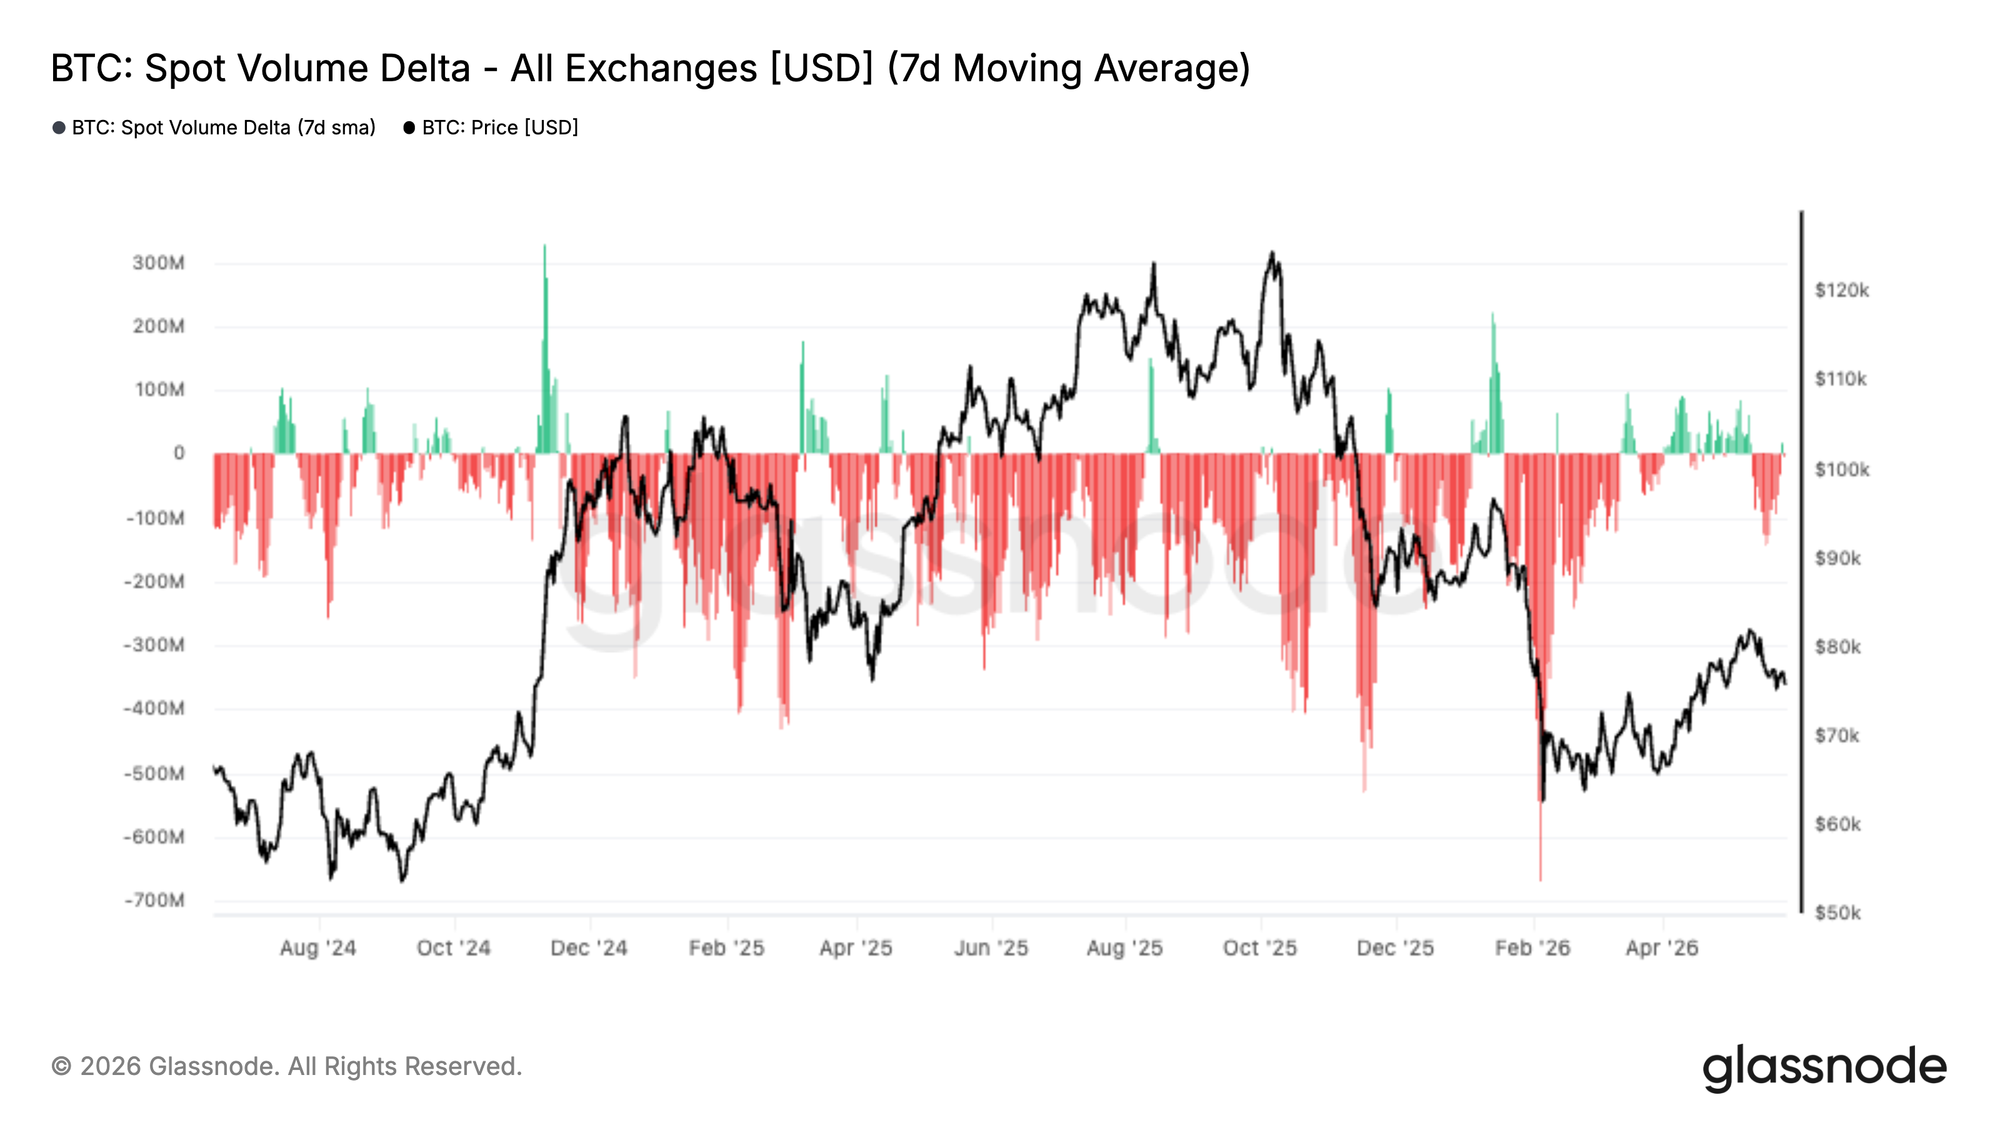
- Spot demand shows no clear direction despite improved price action, with Spot Volume Delta hovering near neutral and BTC recently re-entering the $110K territory, suggesting that buying interest is stabilizing but conviction is limited.
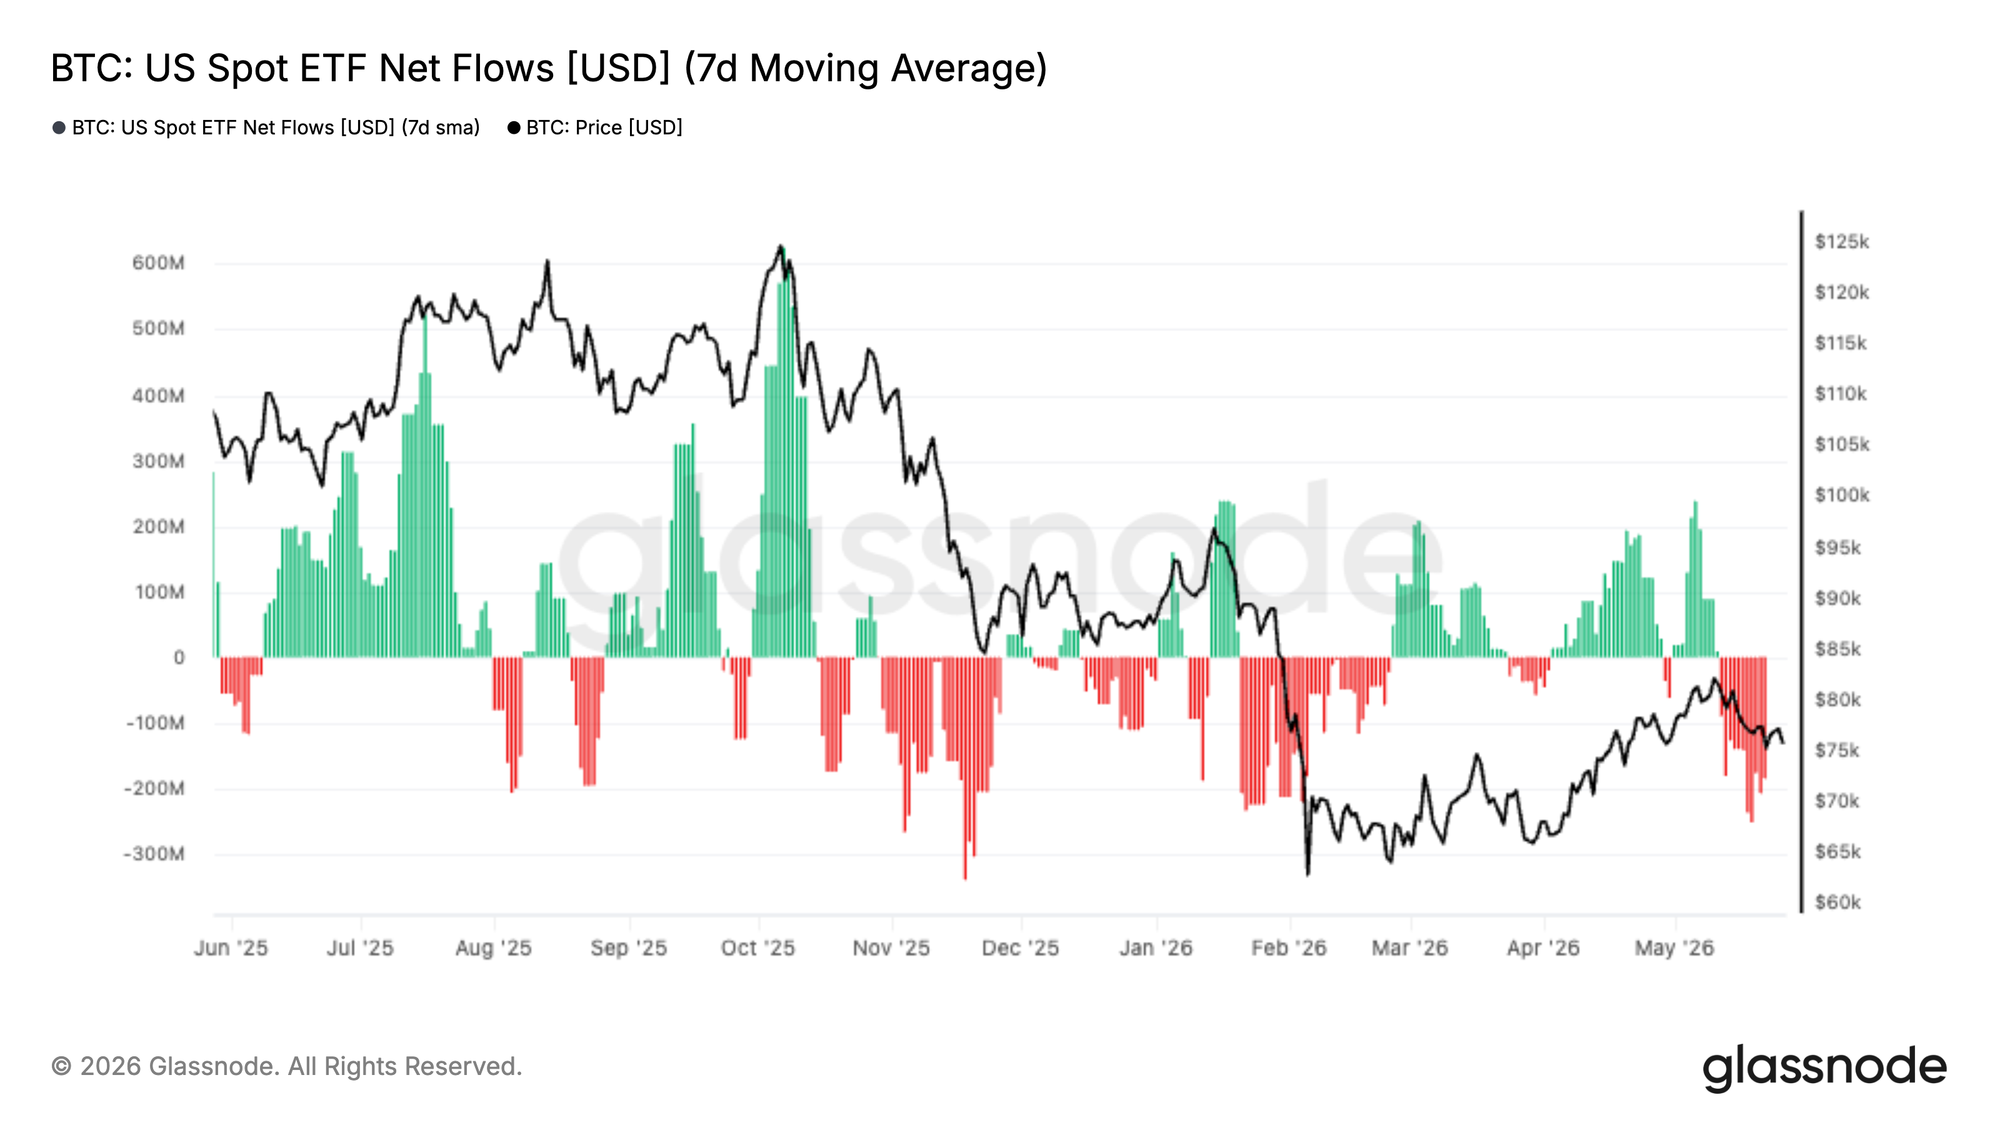
- ETF flows have turned positive again, with US Spot ETFs recording net inflows after several periods of outflows, pointing towards renewed institutional engagement and improving underlying demand conditions.
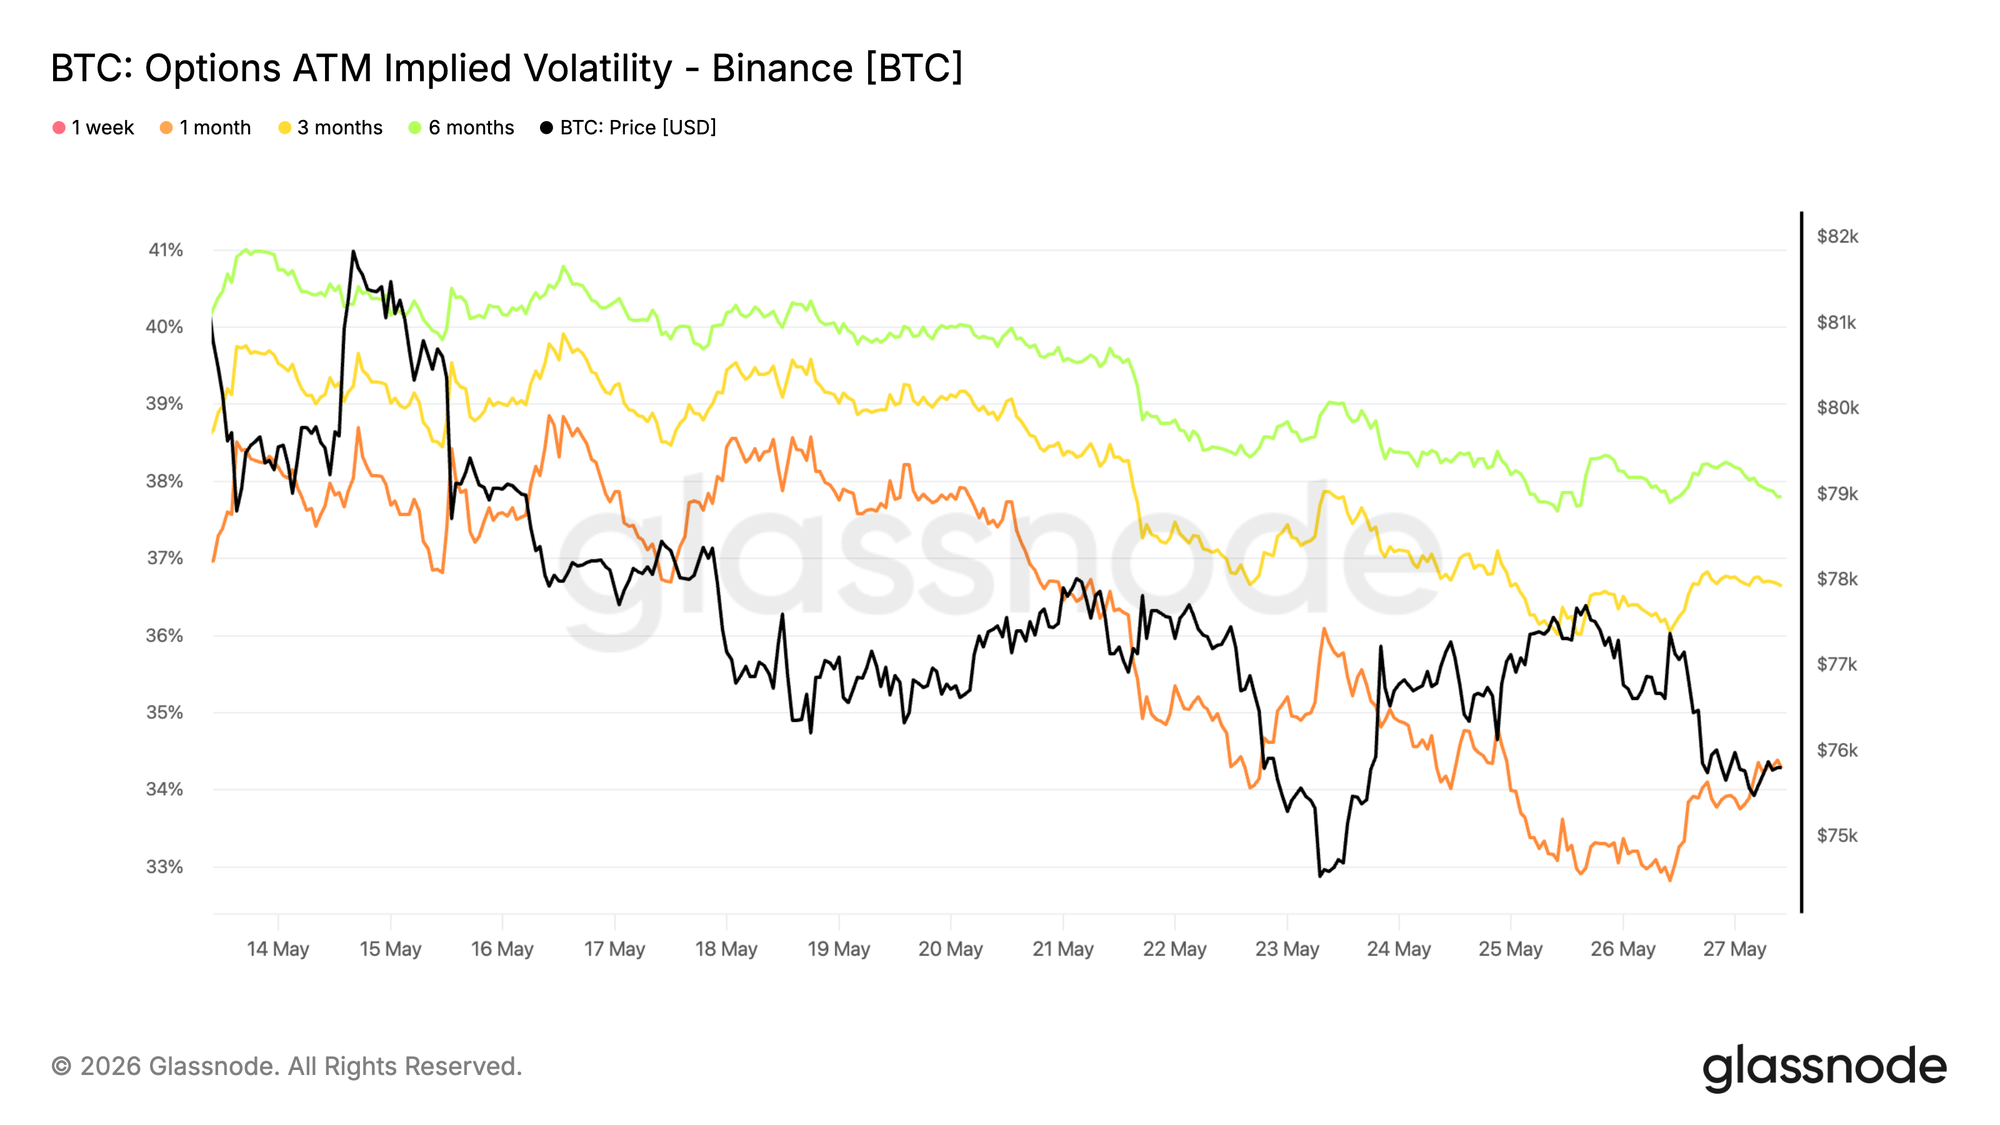
- Implied volatility continues to contract across the yield curve as realized volatility trends downwards, reinforcing calmer short-term conditions and providing supportive carry for volatility sellers.
- Skew remains firmly in put premium territory, although the recent contraction across different maturities indicates a decrease in hedging demand for downside protection and a more balanced options landscape.
- Dealer positioning is concentrated around the May monthly expiry, with over $8B of negative gamma at 75K, making spot highly susceptible to hedging flows towards month-end.
Macro Insights
Liquidity conditions persist in a constrained state heading into the final week of May. The 10-year yield is positioned at 4.51%, marking a 16 basis point increase for the month, while the DXY remains above 99 due to ongoing inflationary pressures from oil. WTI is trading at $93.89, up 54% year-over-year, influenced by the crisis in the Strait of Hormuz. The Federal Reserve is maintaining its stance with rates at 3.5–3.75%, and although rate cuts are the base scenario for H2 2026, elevated energy prices introduce uncertainty regarding this timeline.
The critical variable is Iran. WTI experienced a 2.8% decline today as Secretary Rubio confirmed progressing negotiations, offering the first significant market relief on this front. Gold has already begun to moderate, down 4% this month to $4,495, though still up 36% year-over-year. Bitcoin is consolidating at $76,700 after testing a two-month low of $74,500 last week, tracking global risk appetite rather than deviating from it.
None of these potential shifts have materialized yet. Oil prices still need to stabilize, and currently, they are not fully cooperating. If the Iran deal is finalized and WTI begins to decrease, yields will follow, the dollar will soften, and the outlook will become considerably more compelling. Today’s movement in oil is encouraging, but a single day does not establish a trend. It warrants close observation, but not immediate action.
On-chain Insight
Navigating the Macro Crossroads
Against the backdrop of restricted liquidity, elevated yields, and ongoing geopolitical uncertainty, Bitcoin’s on-chain structure provides a more detailed perspective for evaluating current cycle positioning. A combination of three key cost basis models serves as a useful guide:
- Short-Term Holder Cost Basis ($78k): Tracks the average purchase price of coins held for under 155 days, representing the breakeven point for the most price-sensitive investor segment.
- True Market Mean ($78.3k): Reflects the cost basis of actively traded supply, historically serving as the dividing line between bear and bull market conditions.
- Realized Price ($54.2k): Measures the average acquisition cost across all circulating supply, acting as the cycle’s long-term support level.
Since late April, recent purchasers have accumulated assets within the $75k–$78k range, bringing their cost basis into close alignment with the True Market Mean. This top-heavy configuration mirrors the broader market optimism observed in recent weeks. Should the price stabilize above the True Market Mean, a transition toward pre-bull market conditions remains a possibility. However, any deficit in demand or an external shock risks a significant contraction, as the concentration of new buyers near current spot levels makes this group particularly sensitive to a downturn.
Moderate Capital Flow, Moderate Conviction
Building on the top-heavy cost basis structure detailed above, analyzing the direction and magnitude of capital flow during the recent recovery provides additional context on the strength of this rebound. The Realized Profit/Loss Ratio, presented on a logarithmic scale with a 30-day Simple Moving Average, quantifies the volume of realized profit relative to realized loss over the preceding month, serving as a direct indicator of capital flow bias across the network.
Currently at 1.56, the ratio confirms that the rally from the $60k floor to the True Market Mean has been propelled by a net positive capital flow environment. However, this figure remains well below the historically observed range of 2 to 5, which is typically associated with the early stages of sustained bull markets, suggesting that the conviction behind the current expansion is, at best, moderate. The recent price recovery, while constructive, appears to have been sustained by cautious repositioning rather than the substantial influx of demand that has characterized more enduring cycle transitions.
Sizing Up the Net Capital Flow
Following the assessment of capital flow direction, the next step is to evaluate its magnitude relative to the broader market. The STH Net Realized P&L, normalized by Realized Cap, quantifies the net capital contribution of recent buyers as a proportion of total on-chain capital, providing a precise measure of whether new demand is sufficient to support price expansion. Since the February low, this indicator has recovered from -0.44% to briefly enter positive territory before declining back to -0.02% by mid-May, a trajectory that accurately reflects the rally towards the True Market Mean followed by subsequent sideways consolidation.
While the directional improvement confirms a constructive shift in capital flow bias since February, the scale of this recovery falls short of the levels historically associated with sustained expansion beyond the True Market Mean. This makes the indicator crucial for monitoring in the short term: a continued recovery into significantly positive territory would bolster the argument for a pre-bull market transition, whereas a reversal towards February lows would suggest bear market continuation as the more probable outcome.
Off-chain Insight
Spot Demand Starts Fading
Spot Volume Delta has begun to decline again after a brief recovery into positive territory earlier in May, with recent trading sessions showing a return to net selling pressure as BTC pulled back from the high-$80K region.
This shift is significant because the rebound from the February lows was initially supported by improved spot demand, providing a healthier foundation for the rally. That support has started to wane over the past two weeks, with buyers becoming less aggressive near local peaks and sellers gradually regaining control of spot flows.
For BTC to advance meaningfully from its current position, a resurgence in spot demand is likely necessary. Without it, the market risks reverting to the choppy, seller-dominated conditions that previously capped upside earlier in the year.
ETF Bid Fading
US Spot ETF flows have reversed significantly into negative territory over the past two weeks, with sustained outflows emerging as BTC declined from the high-$80K region. This marks a notable shift from the strong inflow trend observed throughout April and early May, during which ETF demand was a primary catalyst for the recovery rally.
The recent change suggests that institutional interest has begun to cool near local highs, with capital no longer absorbing sell-side pressure at the same pace. Importantly, the current outflow streak is starting to resemble previous periods where a lack of ETF demand coincided with weaker spot momentum and broader market consolidation.
While flows remain considerably higher than the capitulation levels seen earlier in the year, the absence of sustained ETF demand removes a critical source of structural support for the market. Until inflows stabilize, BTC may face challenges in generating sufficient spot demand to sustain a significant breakout above its current range.
Implied Volatility Keeps Compressing Across the Curve
Bitcoin implied volatility continues its downward trend across various maturities, with the most significant compression observed at the front end. The 1-month tenor has fallen from approximately 38.5% to nearly 33% over the last fortnight, while longer-dated expiries have also decreased at a slower pace.
This movement reflects a broader reassessment of short-term price action expectations as spot prices have remained largely range-bound. Short-dated options continue to be sold, indicating a limited willingness among traders to pay elevated premiums for immediate protection or directional exposure.
The curve remains in contango, with longer-dated volatility still trading at a premium to the front end despite the overall compression. As implied volatility continues to decline, the cost of options decreases across maturities, fostering a market environment where volatility sellers maintain dominance and expectations for significant price movements continue to diminish.
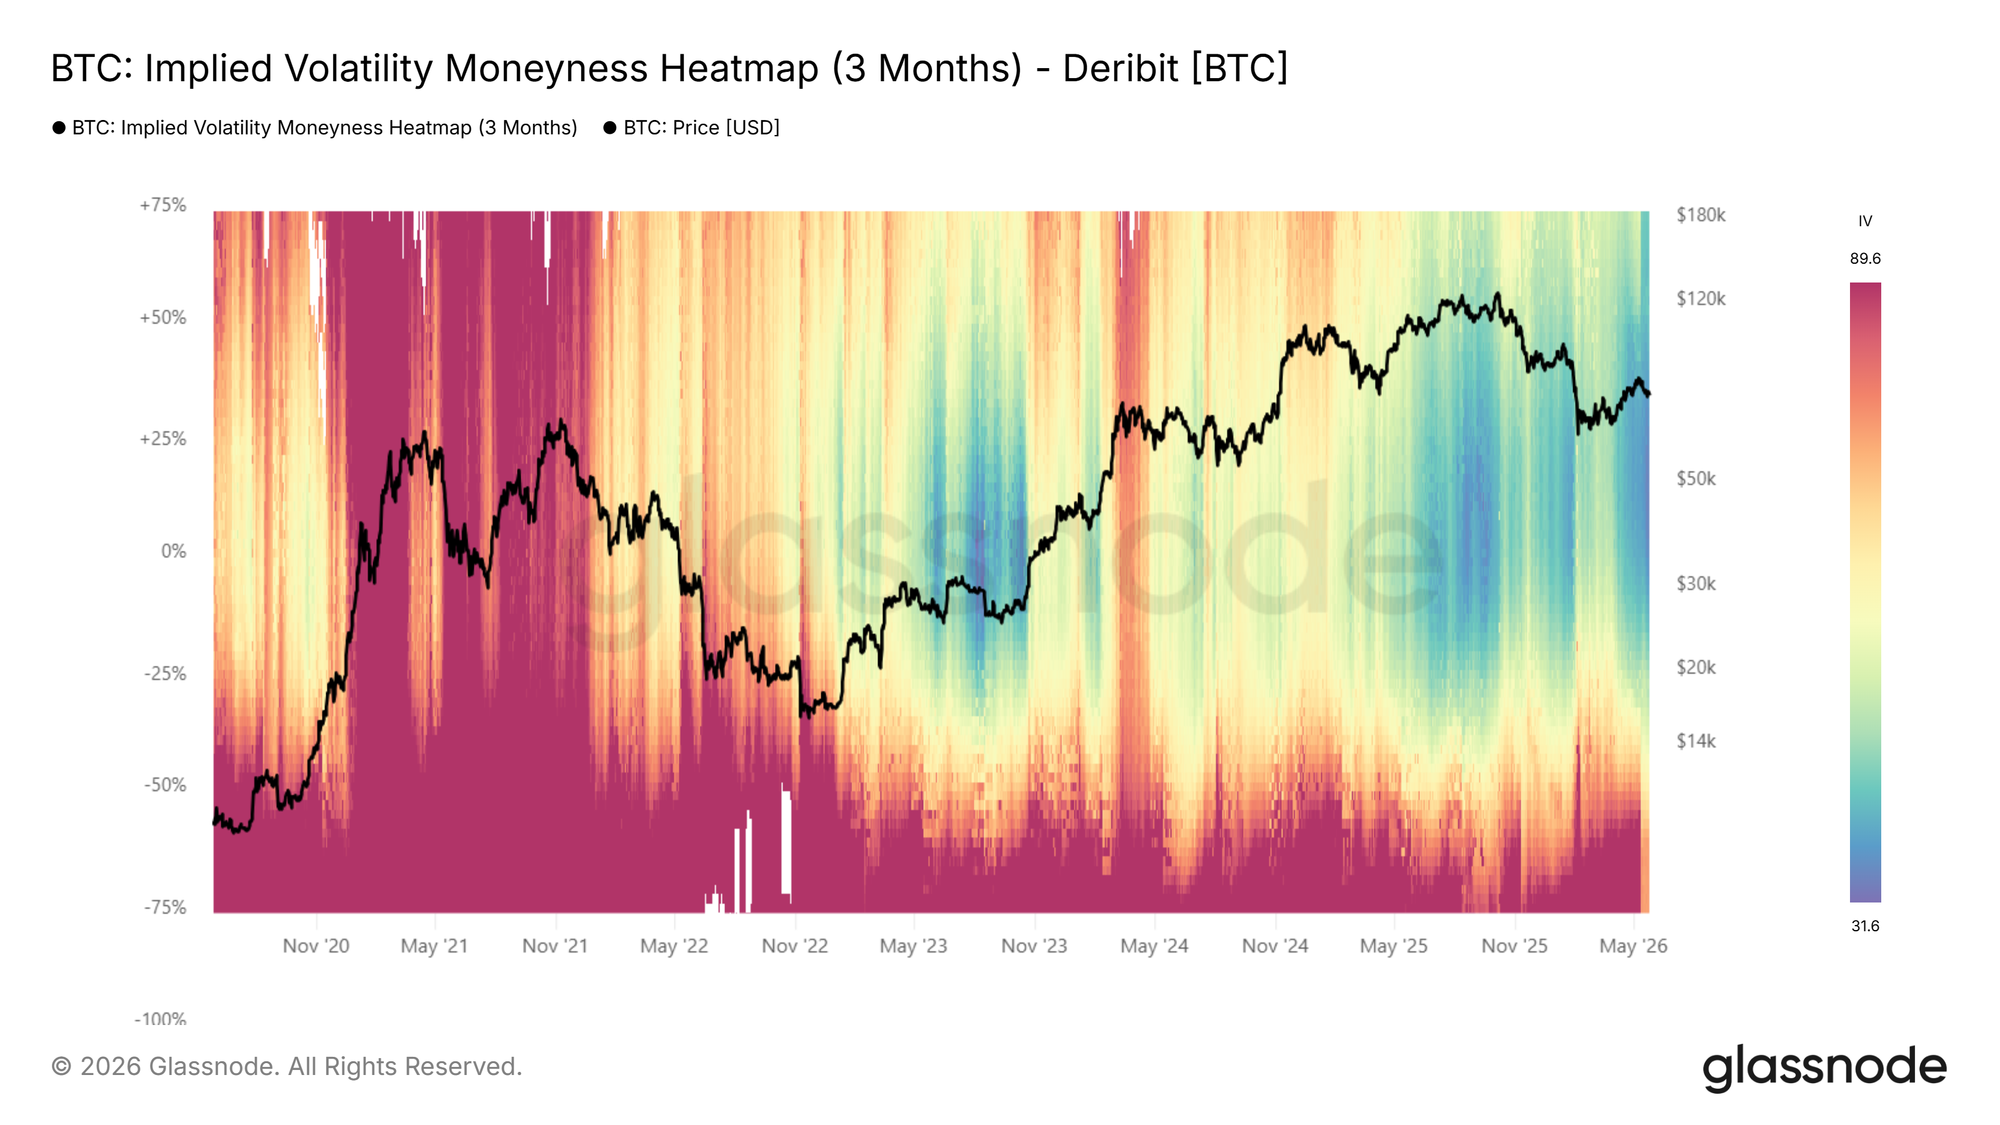
The implied volatility moneyness heatmap further illustrates the recent compression trend. While front-end implied volatilities have been steadily decreasing over the past two weeks, the broader surface now shows volatility pricing across nearly all strike prices near multi-year lows. IVs across the entire strike range, from deep puts to deep calls, are now trading below even the summer 2023 lows, indicating an options market that anticipates minimal large directional movement. This compression is not confined to short-dated maturities but is evident across the entire volatility spectrum, highlighting the subdued nature of positioning and hedging demand.
Volatility Risk Premium Continues to Rebuild
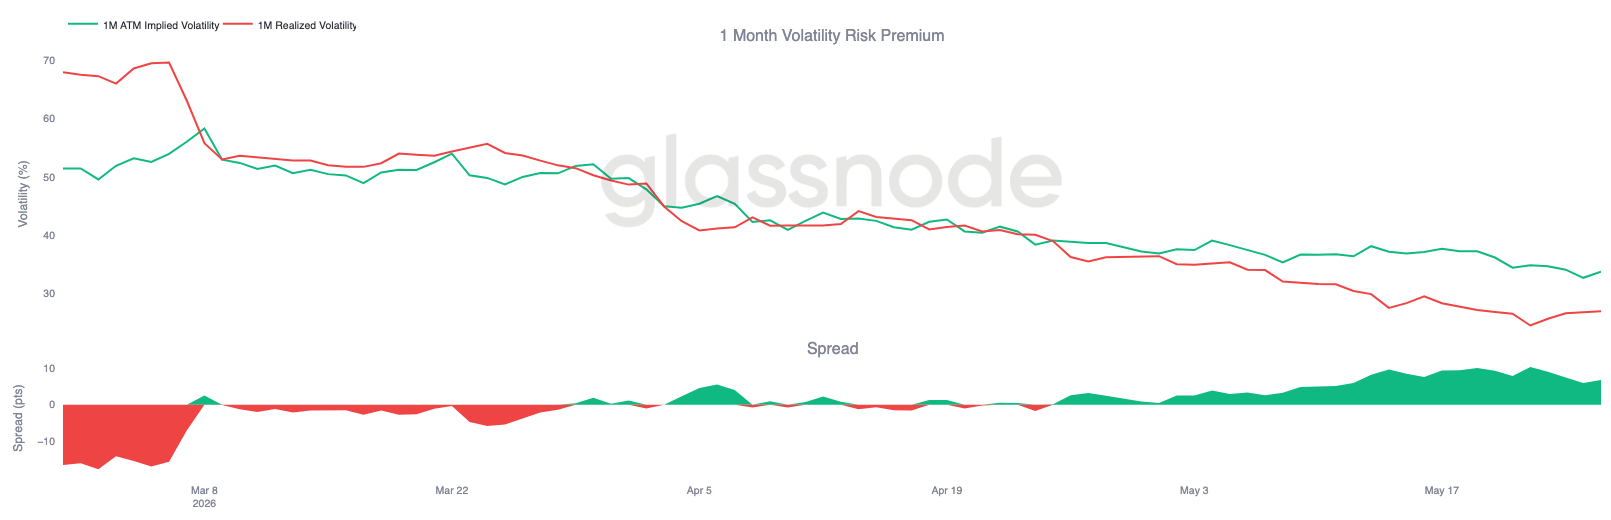
Following the general compression in implied volatility, realized volatility continues to decrease at an even faster rate. Bitcoin’s 1-month realized volatility has now fallen towards the 27% mark, while 1-month implied volatility remains closer to 34%, maintaining a strongly positive volatility risk premium. The spread between implied and realized volatility has steadily widened throughout May, after remaining near flat for much of March and April. In practical terms, options continue to price in more movement ahead than what spot has recently delivered, even as overall volatility levels reset lower. This rebuilding premium reflects a market where demand for options remains relatively robust despite quieter price action. Consequently, carry conditions remain favorable for volatility sellers, with implied volatility continuing to trade at a premium to realized movement.
Put Premium Stays Elevated Across Maturities
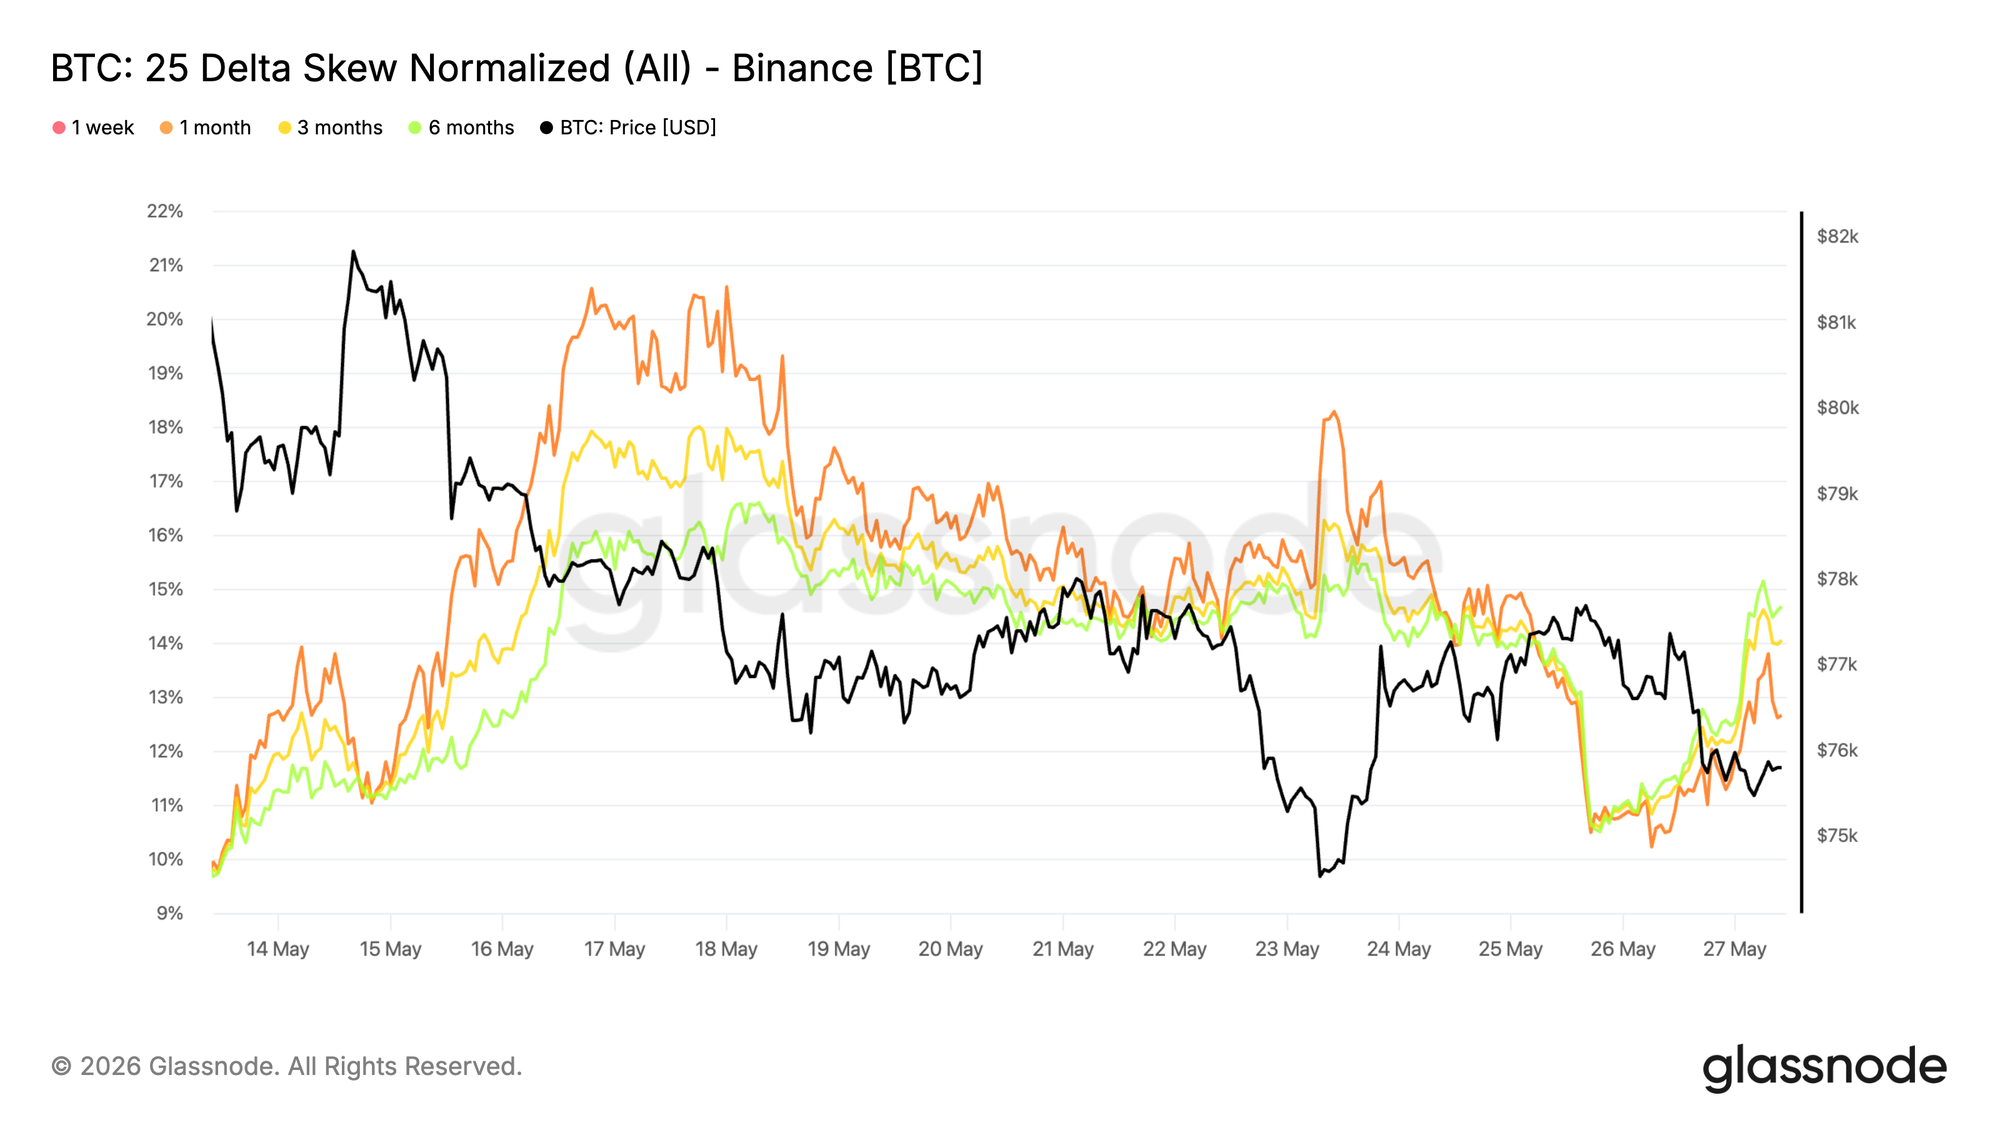
Following the broader contraction in implied volatility, skew has also softened from its mid-May peaks, although positioning remains strongly oriented towards downside protection. As skew is calculated as put minus call, the positive readings across the curve indicate that puts continue to trade at a premium relative to calls. This decrease has been relatively consistent across maturities, with 1-month, 3-month, and 6-month skew all declining in tandem over the past two weeks. The absence of significant dislocations between tenors suggests that the repricing is widespread rather than tied to a specific short-term event or localized hedging demand. While demand for downside hedging has lessened from recent extremes, the options surface remains firmly skewed towards puts across the curve. Consequently, traders continue to pay a considerable premium for protection despite the general stabilization in volatility conditions.
Monthly Expiry Concentrates Gamma Around $75K
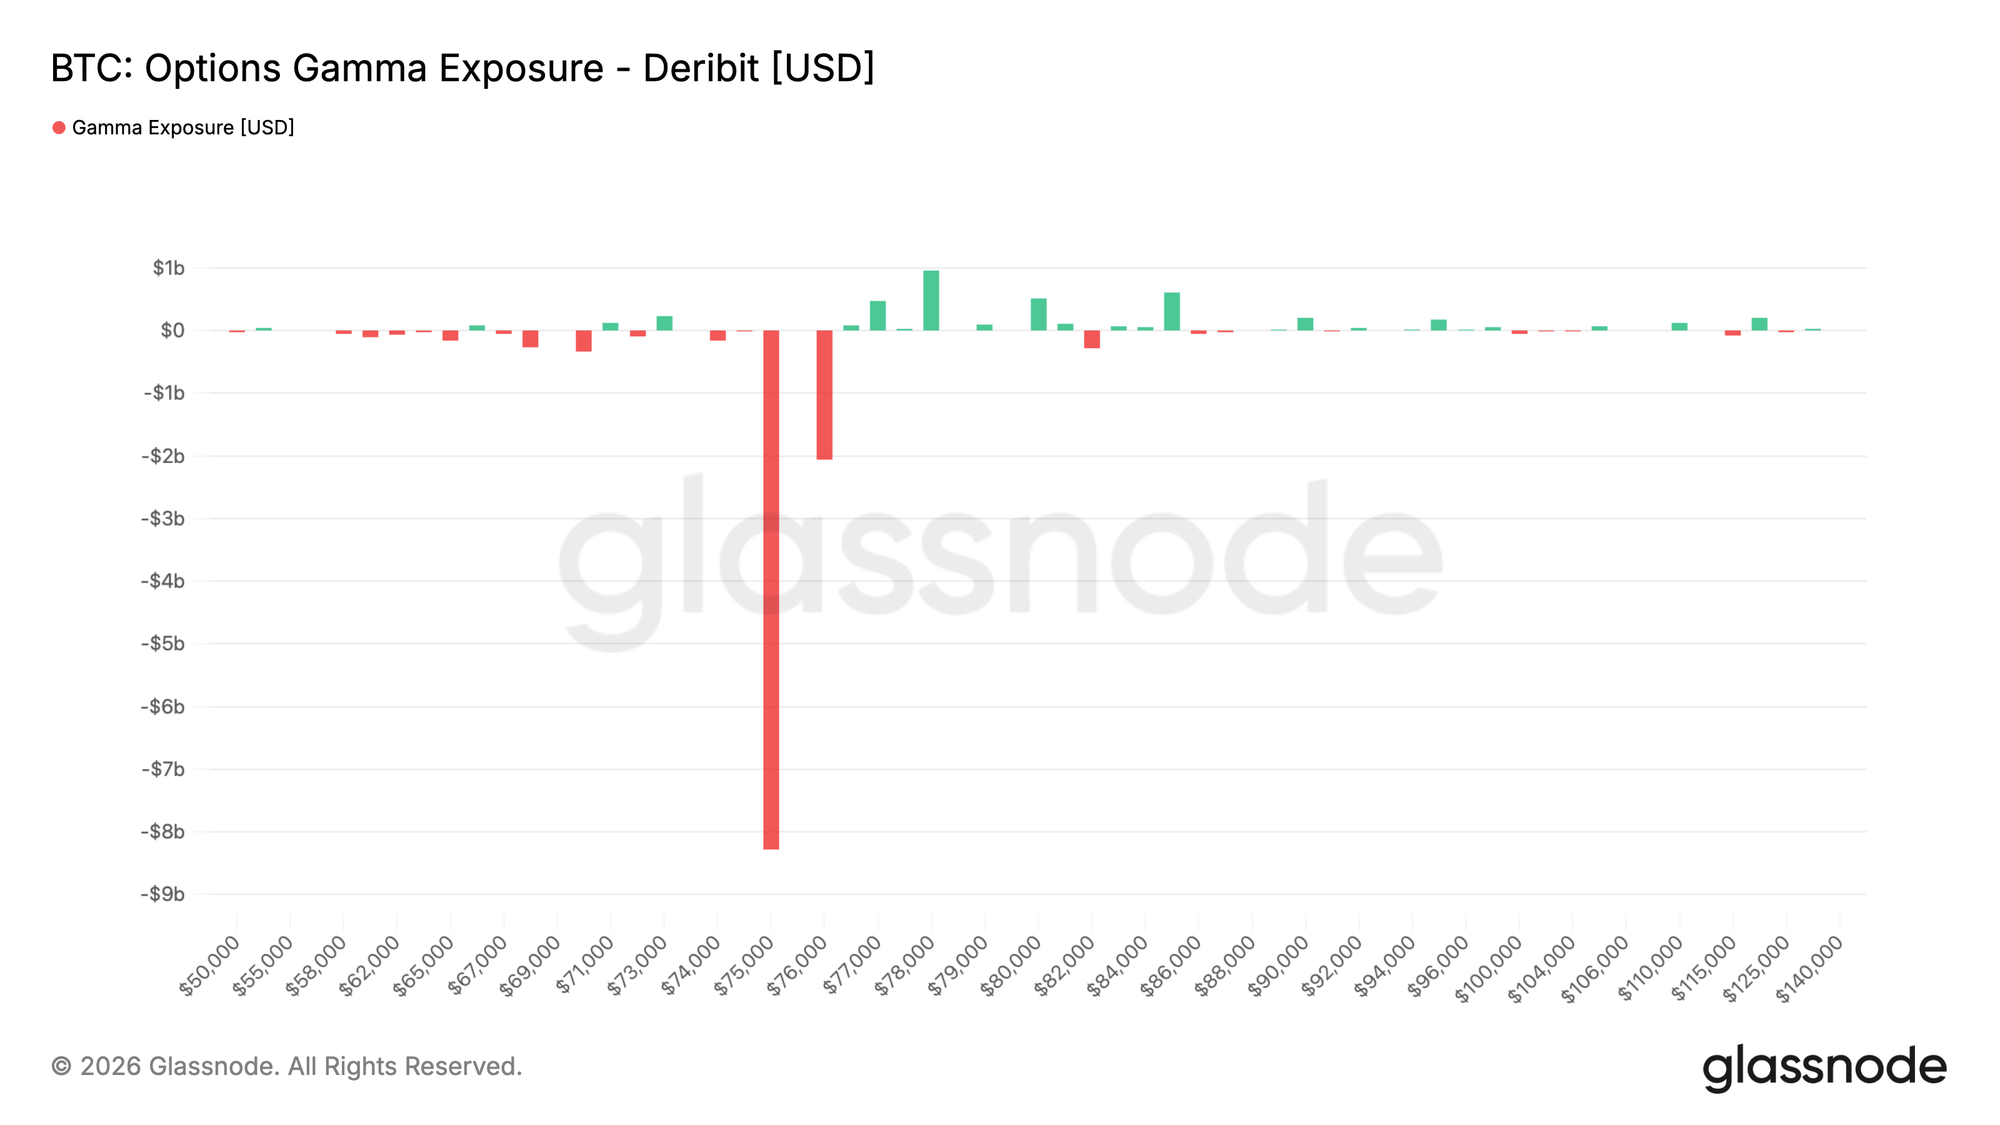
Dealer positioning is heavily concentrated around the $75K to $76K strike range leading up to the May monthly expiry. The most significant negative gamma cluster is located near $75K, representing over $8B in exposure, with another short gamma zone situated near $76K.
The majority of this gamma is set to expire in two days, meaning the substantial dealer hedging flows associated with these strikes will dissipate after the monthly rollover. Until then, spot prices remain highly sensitive to mechanical hedging around the peak negative gamma zone, where dealer activity can amplify short-term price movements. Once expiry has passed, the current positioning landscape will clear, opening opportunities for new exposures to reshape market structure into June.
Flow dynamics also suggest a reduction in protection demand. While put buying dominated 7-day taker premium flow, the past 24 hours have seen a shift towards put selling, indicating that some downside hedges are being monetized nearing expiry.
Conclusion
In summary, Bitcoin continues to stabilize above the mid-$70K area, but the underlying market structure remains notably subdued. Spot demand has weakened again, ETF inflows have reversed downwards, and options markets are pricing in increasingly tempered expectations for significant directional movement. Concurrently, funding rates and broader positioning metrics suggest a market with limited speculative excess, thereby reducing the likelihood of liquidation-driven volatility in the near term. What is most striking is the widespread compression developing across the market. Volatility expectations continue to decline, directional conviction remains limited, and capital flows are becoming more selective. While this environment does not yet indicate a clear structural breakdown, it also suggests that the recent recovery rally is struggling to attract the aggressive spot demand typically associated with sustained upside expansion. For the time being, the $75K region remains a critical level to monitor, impacting both spot demand and positioning. A renewed increase in ETF inflows and spot-led buying would strengthen the case for further upward movement, whereas continued deterioration in capital flows would leave BTC vulnerable to falling back into a broader consolidation range.
Exchange balances presented are derived from Glassnode’s comprehensive database of address labels, which are amassed through both officially published exchange information and proprietary clustering algorithms. While we strive to ensure the utmost accuracy in representing exchange balances, it is important to note that these figures might not always encapsulate the entirety of an exchange’s reserves, particularly when exchanges refrain from disclosing their official addresses. We urge users to exercise caution and discretion when utilizing these metrics. Glassnode shall not be held responsible for any discrepancies or potential inaccuracies.
According to the portal: insights.glassnode.com