Bitcoin Targets $124,000: What to Expect from the Cryptocurrency Price

The supply of stablecoins has surged to bear market levels. CryptoQuant analyst MorenoDV believes this could trigger a new rally in the leading cryptocurrency, Bitcoin (BTC), and the entire digital asset market.
A turning point for Bitcoin
The Bitcoin-to-stablecoin ratio has reached levels that have historically marked the bottom for the coin.
The stablecoin supply ratio (SSR) has fallen back to the “low historical zone (13) – the same one that marked the bottom in mid-2021 and throughout 2024,” the analyst noted.
“Each time, Bitcoin traded in a calm mode before making a powerful rebound,” he said.
On the topic: Morgan Stanley recommended “harvesting” Bitcoin before the arrival of “winter.”
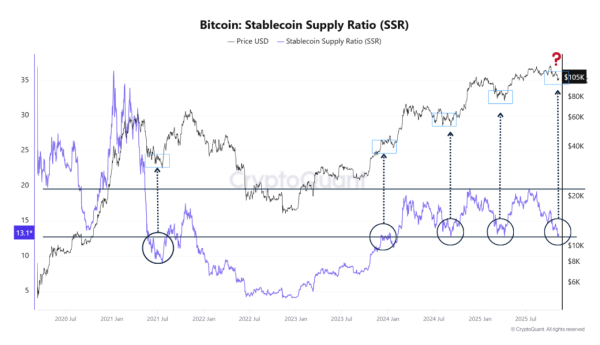 Bitcoin and stablecoin supply. Source: CryptoQuant.
The expert also added that a low SSR is a signal that stablecoin liquidity is increasing. This could pave the way for a recovery rally or a decisive bullish surge in the current cycle.
Binance's Bitcoin/Stablecoin Reserve Ratio (SRR) shows a similar picture. The chart below shows that stablecoin reserves on the exchange are growing, while BTC volumes are declining.
“This is a pattern that emerged immediately before the market recovery. We're seeing a liquidity configuration that has only appeared a few times since 2020, and each instance marked a turning point in Bitcoin's trajectory,” the analyst explained.
Related: Ethereum: New Infrastructure for Wall Street
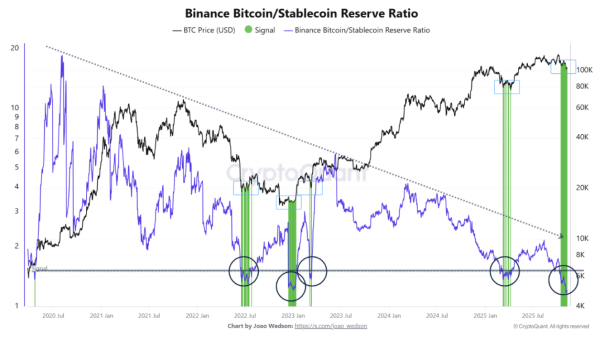 Bitcoin and stablecoin supply on Binance. Source: CryptoQuant.
The growing supply of stablecoins suggests that the amount of idle capital that can be channeled into the crypto market is increasing.
Historically, this pattern has emerged during phases of structural capitulation or seller exhaustion, when weak hands exit the market and strong hands move into accumulation.
Andre Dragos, head of European research at investment firm Bitwise, shared a chart showing that the seller exhaustion constant among short-term holders has reached its lowest level since August 2023.
This indicator typically reaches levels where volatility is low but realized on-chain losses are high.
Similar levels have preceded increases in volatility in the past. The most recent such event saw Bitcoin rise 190% from $25,300 in August 2023 to $74,000 in March 2024.
On the topic: the transition to the third impulse wave will push the Bitcoin price above $200,000
The new target is $124,000.
The daily chart shows the BTC/USD pair trading inside a falling wedge pattern after the price rejected the pattern's upper trendline at $107,000.
A falling wedge is a typical precursor to a bullish reversal, suggesting that the downtrend is coming to an end.
“Bitcoin is trading in a falling wedge. A breakout is very close,” said analyst Mister Crypto.
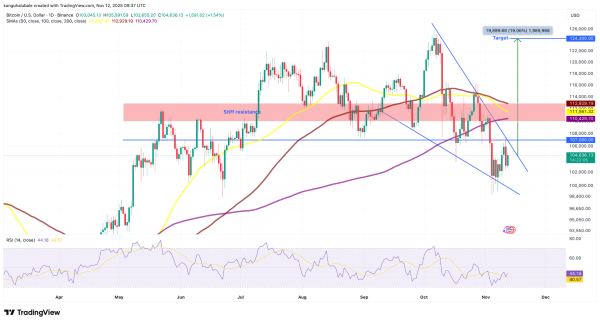 BTC/USD daily chart. Source: TradingView.
If Bitcoin closes above $107,000, the breakout will be confirmed. Then, the next target will be $124,000, which would represent a 19% increase from the current price.
This article does not contain investment advice or recommendations. Every investment and trading decision involves risk, and readers should conduct their own research before making decisions.
Source: cryptonews.net