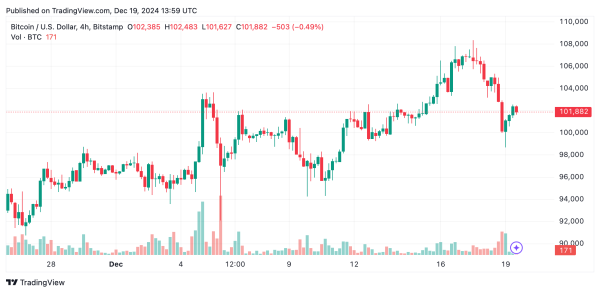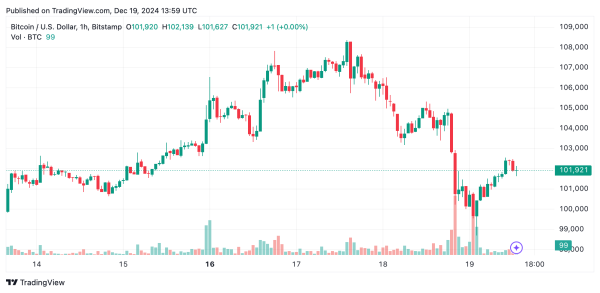
Over the past hour, bitcoin’s price holds tight at prices between $101,696 to $102,057 on Dec. 19, 2024, with a market cap of $2.01 trillion. It danced between $98,839.87 and $104,967 during the day, backed by a lively $104 billion in trades over 24 hours.
On the daily chart, bitcoin rocketed from around $87,000 to nearly $108,000 before encountering heavy selling. The subsequent dip took prices down to a vital support around $98,000. This level has stood its ground despite increased sell-offs, hinting it might be the springboard for the next climb. The commodity channel index (CCI) at 32 and the relative strength index (RSI) at 57 indicate a balanced momentum, but the moving average convergence divergence (MACD) shows a bearish turn with a sell signal on the horizon.
The 4-hour chart reveals a dramatic fall from $108,000 to roughly $98,000, with feeble attempts at recovery. The formation of lower highs points to a short-term bearish mood. Volume analysis shows strong sell-offs during the decline, while buying seems lackluster. Both the 10-period exponential moving average (EMA) and simple moving average (SMA) are flashing sell signals, supporting this trend. Keep an eye out for a breakout over $103,000 or a plunge below $98,000 for decisive moves.

Bitcoin’s 1-hour chart is currently hovering between $101,000 and $103,000, with $98,000 acting as a solid intraday support. The decreasing volume during this period signals that a breakout could be just around the corner. Momentum oscillators like Stochastic at 63 and the awesome oscillator (AO) at 6,305 are neutral, but momentum at 4,280 gives a buy signal. A strong push above $103,000 with increased volume might herald a bullish trend, whereas slipping below $101,000 could lead to revisiting $98,000.

Oscillators present a mixed bag, with most indicators showing neutral signals, except for momentum and the MACD. Moving averages are split; the shorter-term ones (EMA and SMA for 10 periods) suggest selling pressure, while the longer-term averages, like EMA (50) and SMA (50), hint at a buying chance. This contrast highlights the need for vigilant observation of price movements to confirm any directional shifts.
Bitcoin’s ability to maintain strong support near $98,000 despite recent profit-taking suggests resilience in the broader uptrend. A breakout above $103,000 with increasing volume could confirm bullish momentum, paving the way for a retest of the $108,000 resistance or even higher levels. Long-term moving averages, like the EMA (50) and SMA (50), also align with a bullish perspective, supporting further upside potential.
The emergence of lower highs on shorter timeframes, coupled with sell signals from short-term moving averages like the EMA (10) and SMA (10), points to potential bearish pressure. If bitcoin breaks below the $98,000 support with strong volume, it may accelerate selling, with the next major support level around $92,000. Traders should watch for signals from the MACD and volume trends to confirm a bearish reversal.
Your email address will not be published.
[…] January 2022, the number of cryptocurrencies existing in the market increased by 1 thousand. This implies that each new…
Your writing is like a breath of fresh air in the often stale world of online content. Your unique perspective…
I would like to share my story and express my great gratitude to Maria. My husband Alexander was literally taken…